 Saad Ullah

Tesla shares are at a crossroads. After peaking near $500, TSLA has pulled back steadily and now sits in a support zone between $383 and $396, with traders watching two key price levels that could define the next significant move in either direction.
TSLA Momentum Fades Below $420 Moving Average
Tesla is currently trading in the $396-$403 range, pressing against a demand zone the market has tested before. The stock is holding below its short-term moving average, while the longer-term moving average near $420 sits above current price, a structure that signals weakening momentum after a strong rally. As noted in Tesla Stock Tests Critical $394 Support Level at 200 EMA, this general area around $394 has already acted as meaningful technical support, with the 200-day moving average reinforcing its significance.
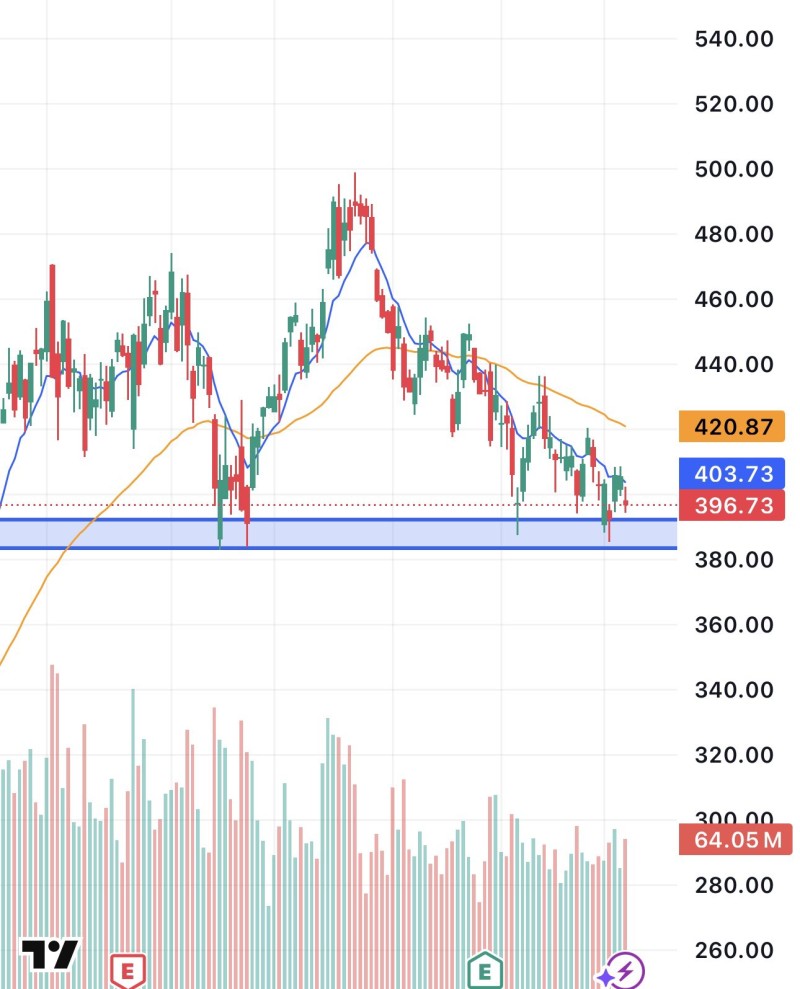
$410 Breakout or $383 Breakdown: What Happens Next
A move above $410 would change the picture considerably. That level represents the threshold where bullish momentum could re-emerge, with the $500 area as the logical next target. Tesla (TSLA) Price Analysis: Breakout Could Drive Stock Toward $500 laid out a similar scenario, noting that a confirmed breakout above resistance could open the path back toward that milestone.
On the downside, losing $383 flips the structure bearish. A break below that level points toward $350 as the next area of interest, consistent with the broader corrective pattern TSLA has been tracing since its highs. TSLA Stock Stays in Correction Below $418.86 Resistance reinforces the same theme, showing the stock has continued to struggle below key resistance zones during this phase.
Consolidation near major support often marks a decision point for any stock. How Tesla behaves around the $383-$410 band in the near term will likely answer whether this is a base-building phase before a recovery, or the beginning of a deeper move lower toward the $350 region.
 Saad Ullah


