Alex Dudov

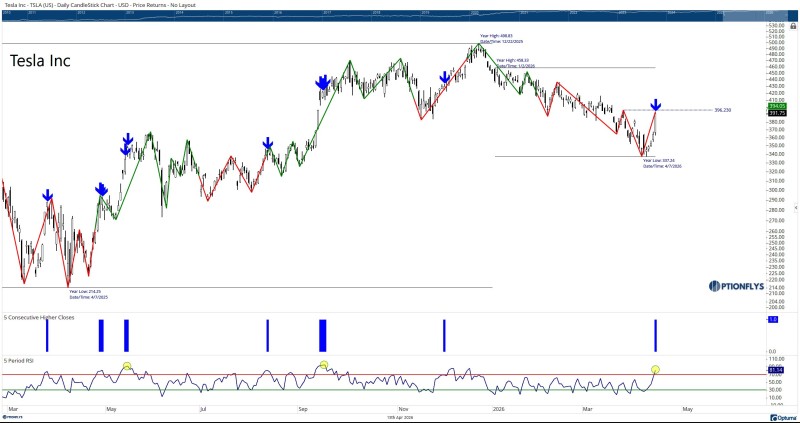
TSLA has posted five consecutive higher closes, matching momentum bursts seen at previous turning points on the chart. Analyst Mo noted that while the move can continue, the easier part of the rally may already be behind - a distinction that matters for anyone considering entering now.
Price has rebounded sharply from recent lows and is now approaching a clearly defined supply zone. At the same time, momentum indicators are stretched into elevated territory, shifting the character of the trade considerably.
The move can continue, but the easier part of the rally may already be behind.
5-Day TSLA Streak That Signals Acceleration
The chart shows a sequence of five consecutive higher closes, with repeated signals marking similar momentum events in the past. The previous comparable rally extended to seven sessions before losing strength - and the current move is now approaching that same zone. TSLA Slides Below 200DMA as Bearish Trend Deepens covered how quickly sentiment can reverse once a rally exhausts itself.
That historical context aligns directly with the view that the move is late, not early - a critical framing for anyone weighing entry risk at current levels.
When five straight green candles stack up near a resistance ceiling, you are no longer hunting early-stage setups - you are managing late-stage risk.
TSLA Price Returns to a Defined Supply Zone Near $390-$400
The rebound has carried TSLA back toward a horizontal resistance area near the 390-400 region, marked on the chart as a supply zone. This level has previously acted as a ceiling where price struggled to sustain upside. Now that price has returned to it, the structure shifts from recovery into resistance testing - a fundamentally different environment.
That transition matters because the chart no longer reflects open upside but rather a test of an area where sellers have historically been active. TSLA Stock Builds Base Near 325 MA, Eyes $420 traced the base formation that preceded the current push, providing useful context for how the level developed.
TSLA Momentum Is No Longer Neutral - RSI Pushes Above 80
The RSI panel on the chart shows a sharp move into elevated territory, with readings pushing above 80. This indicates that the current rally is stretched on a short-term basis. Previous instances where RSI reached similar levels coincided with pauses or pullbacks rather than continued expansion.
This does not mean price must reverse immediately, but it reinforces the idea that the move is no longer developing from a neutral base - and that the risk profile has shifted accordingly. TSLA Stock Tests Key $420-$425 Zone as Head-and-Shoulders Pattern Emerges highlighted how similar overbought conditions previously resolved near key resistance.
An RSI above 80 does not kill a rally by itself - but it tells you the conditions that made entry obvious are no longer present.
Where Late Buyers Typically Step In
The chart structure reflects a classic late-stage momentum phase. Several conditions are now stacking simultaneously:
- Five consecutive green sessions already completed
- Price testing a clearly defined supply zone near $390-$400
- RSI stretched into overbought territory above 80
This combination matches the type of environment where traders often begin chasing strength rather than entering early in a move - precisely the dynamic that tends to introduce the most risk for new participants.
A TSLA Rally That Can Continue - But With Less Edge
TSLA is still moving higher, and the structure allows for additional upside. However, chart signals point to the same conclusion: the character of the move has changed. The early, higher-probability portion of the rally has likely already occurred. What remains is a continuation attempt into resistance, where reactions tend to become less predictable and risk increases for traders entering at current levels.
 Alex Dudov