Saad Ullah

Tesla (TSLA) is approaching a critical decision point, trading around $391 as the stock compresses between a descending resistance trendline and key support near $380. A recent failed breakout near the upper trendline has shifted short-term momentum toward sellers, keeping the stock locked in a tightening range.
The chart shows multiple rejections at descending resistance alongside repeated tests of support around $380, a setup explored in detail in TSLA Triangle Tightens Near $395 as Bollinger Band Squeeze Signals Big Move. Converging trendlines like this typically signal a coming volatility expansion once the range finally breaks.
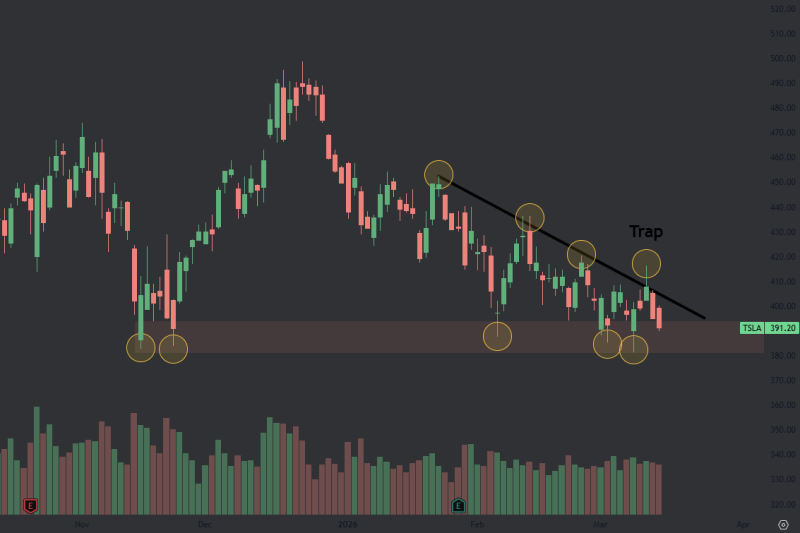
The next directional signal depends on how TSLA resolves this compression. A close above $406 would likely trigger a push toward the $500 region. A break below $380 would shift the structure bearish, with the next major support near $320. Both scenarios have been mapped in Tesla Tests $383 Support With $410 Break Key to Next Move, where analysts pointed to these same thresholds as the primary trend triggers.
Broader commentary has repeatedly flagged the $380 to $395 zone as a critical pivot region. As discussed in Tesla Holds $387 Pivot -- 2nd Test in 5 Weeks, the $387 area has attracted buyers on multiple pullbacks over recent weeks. With TSLA now pressing against descending resistance from within that same zone, the interaction between $406 and $380 defines the entire near-term technical picture.
This consolidation reflects broader indecision in the Tesla chart. When price tightens between resistance and support for an extended period, it tends to build pressure ahead of a larger move. Whether TSLA breaks out or breaks down from here will determine if the stock enters a renewed rally or extends its correction.
 Saad Ullah