 Marina Lyubimova

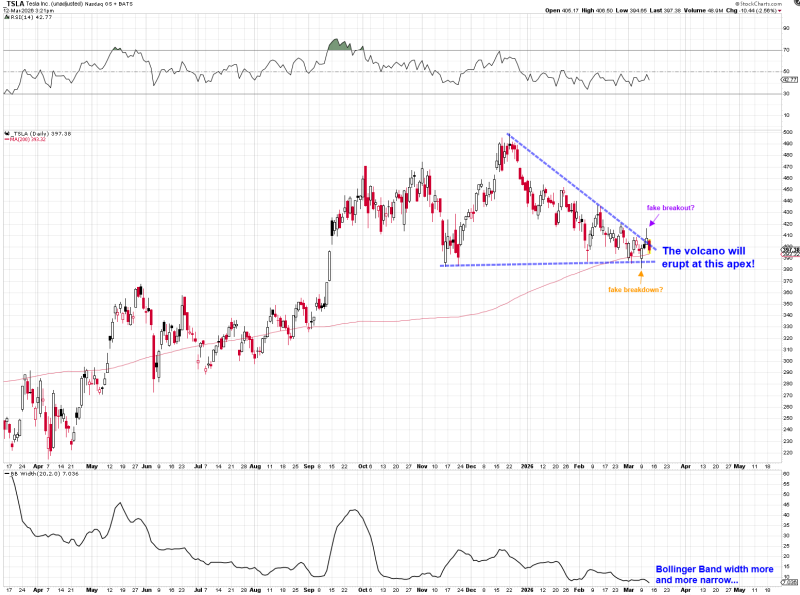
TSLA stock is deep in a compression phase, with price grinding between $395 and $400 inside a symmetrical triangle on the daily chart. Converging trendlines are pushing the price toward an apex, and the setup looks like a classic calm-before-the-storm structure. Recent sessions have seen both a false breakout above resistance and a false breakdown below support -- two failed attempts that tell you the market hasn't made up its mind yet.
200-Day MA at $393 Holds the Line
The triangle itself has a descending resistance line connecting recent highs and a rising support line pushing from below. Right in the middle sits the 200-day moving average near $393 -- one of the most-watched technical levels for TSLA price at crucial resistance. When price stays pinned around a long-term MA like this, it usually means the market is coiling. The longer the coil, the sharper the eventual move.
Bollinger Band Squeeze Points to Volatility Expansion
What makes this setup stand out is the Bollinger Band width shown in the lower panel -- it has been shrinking steadily. Narrow Bollinger Bands mean volatility is being compressed, and history shows that kind of squeeze rarely lasts. The analysis in Tesla TSLA breakout toward $500 highlighted the same dynamic: tight consolidations that precede strong directional moves once key resistance breaks.
The full picture -- false moves in both directions, a tightening triangle, and shrinking Bollinger Bands -- points to a volatility expansion phase approaching fast. Whether TSLA breaks up or down, the structure suggests the next trend move could be significant. Prior setups covered in Tesla stock breakout eyeing $367 showed how quickly price can shift gears once the coil releases. Traders watching TSLA right now are essentially waiting for the market to show its hand.
 Marina Lyubimova


