 Eseandre Mordi

SoFi Technologies (SOFI) is drifting without clear direction on the weekly chart, caught between prior support and resistance levels with no real catalyst to push it either way. Analyst Fibby., writing for SOFI Stock Tests $18.83 Support: Will 0.786 Fib Level Hold?, describes the stock as sitting in "no man's land" - with the next meaningful move likely pointing lower, toward the $12.75-$14 range, before any reversal can realistically take shape.
SOFI Structure Caught Between Trend and Correction
The chart tells a pretty clear story. SOFI had a strong run, peaking somewhere in the high-$20s, before momentum dried up and the stock rolled over. What followed was a shift from a bullish trend into a corrective phase - and that corrective phase is still unfolding.
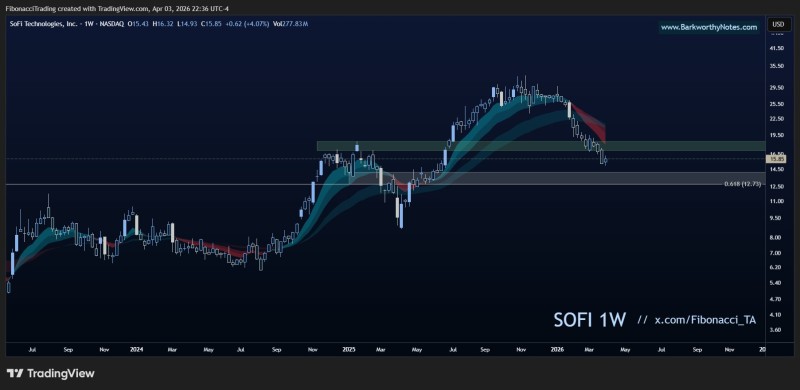
Recent weekly candles reflect steady selling pressure, with price slipping below a key horizontal zone in the mid-to-high teens. That zone was previously a support area, but price is now bumping into it from below, which is a fairly reliable sign that the dynamic has flipped. Former support acting as resistance is a classic signal that sellers are in control.
The moving average ribbon on the chart has also started to roll over, which adds another layer of confirmation that the prior uptrend is no longer intact - at least not in the near term. These are not dramatic signals on their own, but taken together, they paint a picture of a market that is still working through a correction rather than building toward a recovery. Investors tracking SOFI Stock Analysis: Support Hold at $16-$19 Could Trigger Move to $28 will recognize the technical structure that defined the prior setup.
Why the $12.75 SOFI Level Is the Key Downside Target
The most closely watched level on the chart right now is $12.73, which aligns with the 0.618 Fibonacci retracement of the prior move. Fibonacci retracements are widely used in technical analysis to identify where a pullback might find support - and the 0.618 level, sometimes called the "golden ratio" retracement, is one of the more reliable of them. The fact that this level sits within the broader $12.75-$14 target zone makes it a natural area of interest for traders watching for a potential bottom.
Critically, price has not reached this zone yet. That suggests the corrective leg is still in progress. There is no confirmed base forming, no reversal pattern on the chart, and no structural reason to expect buyers to step in aggressively above this level. Corrective phases in trending assets often extend further than expected before stabilizing, and this one appears to be no different. For context on how prior setups evolved, the SOFI Stock Analysis: Cup & Handle Pattern Signals $61 Target Potential outlines the longer-term bull case - but that thesis needs a proper reset first.
Resistance Now Caps Any SOFI Recovery Attempt
Above the current price, the chart shows a well-defined resistance band running from roughly $16 to $19. This is where multiple prior price reactions occurred during earlier trading, and it now acts as a ceiling for any short-term bounce. As long as SOFI trades below this zone, recovery attempts are likely to be sold into rather than sustained. The structure is consistent with a market searching for equilibrium after a strong prior trend - and equilibrium tends to come at lower prices when the corrective phase is still underway.
Resistance between $16 and $19 now caps any near-term recovery attempt. The corrective move appears incomplete, with the $12.75-$14 region positioned as the most likely reaction zone.
- Price remains below former support, which has flipped to resistance
- The corrective move appears incomplete, with no base or reversal pattern yet confirmed
- The $12.75-$14 region is positioned as the most likely downside reaction zone
A Setup Still Waiting for Completion
The short-term picture for SOFI points to continued downside pressure, but that does not rule out a larger recovery further down the line. The broader framework leaves room for a meaningful bounce - just not yet. For that to happen, the stock needs to complete the current corrective leg, find a proper reset at or near the $12.75-$14 zone, and show some evidence of buyers stepping in before the technical case for a reversal becomes credible. Until then, SOFI remains in transition - a stock that had a strong run, is now unwinding that move in an orderly way, and has not yet reached the level where that process is likely to end.
 Eseandre Mordi


