 Usman Salis
⬤ SoFi Technologies Inc. stock is showing signs of a classic cup and handle formation on the monthly timeframe. This technical structure points toward a potential upside target around $61 once the pattern confirms with a breakout above the handle's resistance. The setup has caught the attention of several market observers, who highlighted the developing chart pattern.
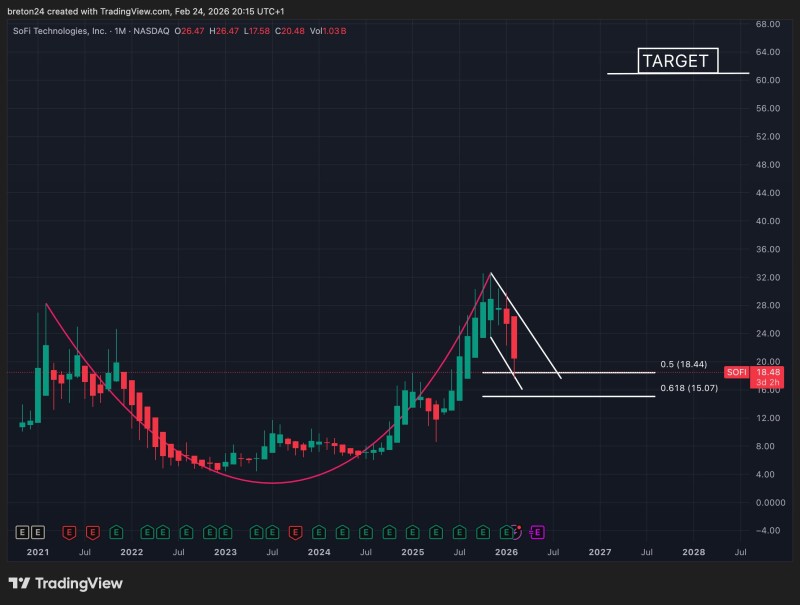
⬤ The monthly TradingView chart shows a gradual rounded base - the "cup" portion - that took shape after the stock bottomed out in 2022 and early 2023. Following a multi-year rally that pushed shares into the $30s, SOFI stock is now carving out the "handle" as price pulls back from recent highs. Key technical levels sit near the 0.5 and 0.618 Fibonacci retracements at roughly $18.44 and $15.07, while current price hovers near $20.48. This measured pullback fits the textbook behavior for a cup and handle's second phase.
⬤ For confirmation, SOFI needs to push through resistance formed by prior highs near the mid-$30 range. A decisive monthly close above those levels typically validates the pattern and activates the projected target zone between $60-$64. Recent price action around $20 support shows the handle forming within a controlled range. Without a breakout, though, the current structure remains just a developing pattern that could face further consolidation.
⬤ Cup and handle formations on monthly charts matter because they span significant timeframes and reflect market psychology around accumulation phases. If SOFI confirms the breakout, it could reshape medium to long-term technical expectations and influence sentiment across the broader fintech sector. The $18 support zone remains critical for the pattern's integrity. A failure to hold above key handle boundaries could keep the trend neutral or trigger extended corrective moves instead.
 Usman Salis


