 Saad Ullah
SoFi Technologies shares are at a critical juncture as the stock pulls back to test a key support zone that could determine its next major move. With the price hovering near $19.36, technical analysts are closely monitoring whether the confluence of Fibonacci support and a long-term moving average will hold the line or give way to deeper retracement.
SOFI Finds Support at 0.786 Fibonacci and 20-Month Moving Average
SoFi Technologies (SOFI) has pulled back toward the 0.786 Fibonacci retracement level near $18.83, marking a technical test of this support zone after retreating from earlier highs. The monthly candle formation around this area also finds support from the 20-month simple moving average, creating a confluence of key technical levels. The shares currently trade near $19.36, just above the monthly moving average of $17.73, a critical threshold traders use to gauge whether the long-term uptrend stays intact.
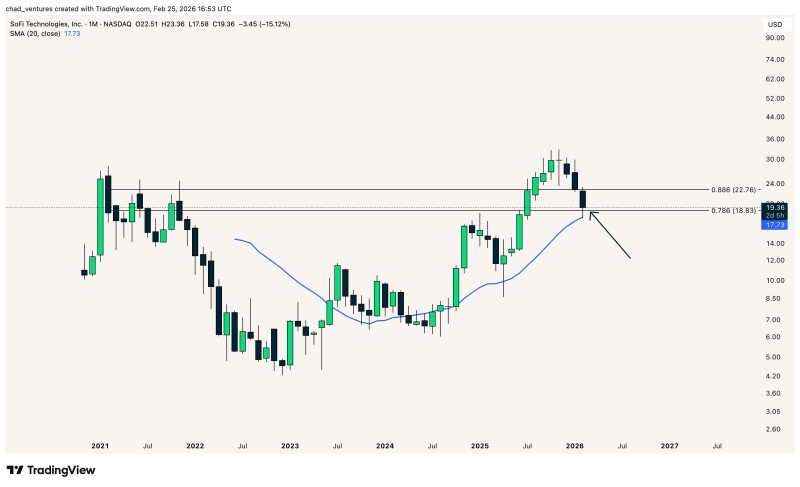
The chart shows SOFI's descent toward the 0.786 log Fibonacci and the 20-month SMA has created a potential floor in recent sessions. While shorter-term moving averages like the 20-day and 50-day SMAs sit well above current price levels - consistent with broader market pullbacks - the longer-term monthly structure appears to be holding above the critical support area. Historical data reveals that the 0.786 Fibonacci retracement level often serves as a pivot point for trend continuation during extended rallies.
Technical Confluence Could Signal Trend Continuation
Traders note that breaking below this $18.83 area could undermine the current bullish structure, whereas defending this zone might set up a re-test of recent resistance levels closer to the mid-$20 range. The interplay between the 20-month SMA and Fibonacci retracement draws from established technical principles that monitor trend health and corrective depth. The bullish higher-low structure that was intact before this retracement remains a key reference point for SOFI stock analysis.
This technical setup matters because holding confluence support levels could influence the broader pattern interpretation for SOFI into the medium term. If the pattern results in a confirmed higher low on the monthly chart, it may reduce short-term downside risk and maintain the narrative of trend continuation. Conversely, failing this support could suggest extended consolidation or deeper retracement, similar to what was observed when SOFI stock broke down near $24 in previous sessions.
 Saad Ullah


