 Saad Ullah

⬤ SoFi Technologies is testing a critical zone on the weekly chart, with price pulling back into an area that previously acted as resistance. According to Fibby., this region now functions as potential support and represents a "prime real estate" zone offering a favorable risk-to-reward setup at a key structural turning point.
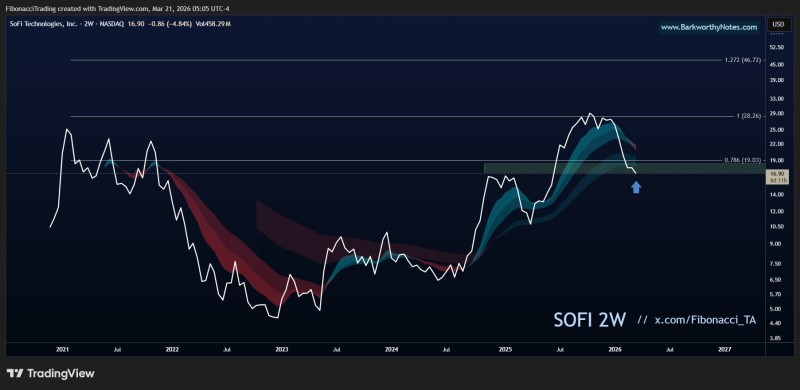
⬤ The chart shows SOFI retracing into the $16-$19 range, aligning with a 0.786 Fibonacci level and prior resistance. As noted in SOFI Stock Tests $18.83 Support: Will 0.786 Fib Level Hold?, this type of retest structure is often associated with trend continuation when support holds.
⬤ Market attention now centers on whether SOFI can hold this support and push higher. If it does, $28 is the first key target. As explored in SOFI Stock Eyes Rebound After Testing $16.95 Fibonacci Support Zone, holding near $17 has historically been linked to recovery scenarios. A break below the zone, however, would invalidate the setup and signal further downside risk.
⬤ SOFI sits at a clear inflection point within its broader trend. As outlined in SOFI Stock Eyes $18 Support Zone - Can It Stage a Rally to $45?, pullbacks into this range signal either consolidation or early trend continuation depending on how strongly support holds. The reaction here will likely define near-term sentiment and whether the recovery continues.
 Saad Ullah


