 Usman Salis
Price is sitting at the upper boundary of a high-volume zone, where current positioning suggests a decisive move may follow. SOFI is once again centered around a critical institutional price level - $16 has reclaimed dominance with 87.8 million shares, overtaking $15, which now holds 28.3 million. The chart confirms this structure, showing a clear concentration of activity between $15 and $16, with price positioned directly on the upper anchor. According to Fibonacci_TA, the shift in volume leadership is a meaningful signal about where institutions have repositioned.
$16 has reclaimed dominance with 87.8 million shares, overtaking $15, which now holds 28.3 million - the shift back signals that institutional positioning has moved upward within the same range.
The SOFI Rotation That Defines the $15-$16 Zone
The chart does not show a broad distribution of volume - it shows concentration. The majority of dark pool activity is clustered tightly between $15 and $16, with a combined total of approximately 116 million shares.
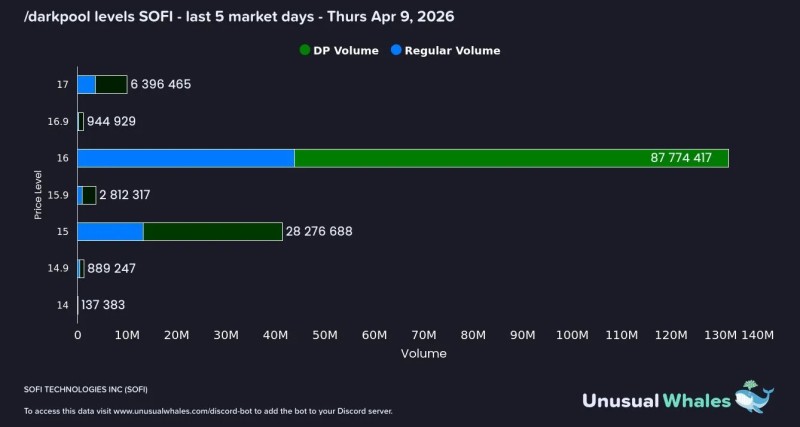
This rotation between the two levels over recent weeks is the defining feature of the structure. Previously, $15 acted as the dominant anchor with significantly higher volume, but the shift back to $16 signals that institutional positioning has moved upward within the same range. What matters is not which level leads at any given moment, but that both levels continue to absorb the majority of activity.
The rotation between $15 and $16 is the defining feature of the current structure - both levels continue to absorb the majority of dark pool activity, regardless of which leads at any given moment.
Where SOFI Participation Falls Away
Outside this zone, participation drops sharply. The chart shows minimal volume below $15, with sub-$1 million readings across lower levels, while above $16, activity thins out toward $17 with only modest presence. A more recent shift toward a single dominant level is explored in SOFI Stock Reprices as Dark Pool Volume Collapses to $15 With 143 Million Shares at One Level, highlighting how institutional focus can move sharply within a range.
This creates a highly asymmetric structure:
- Heavy concentration between $15 and $16
- Limited support below
- Lighter resistance above
Such imbalances often define how price reacts once it leaves the core zone.
The SOFI Signal Traders Are Watching Now
From a technical analysis perspective, SOFI stock is not trending - it is compressing around an institutional anchor. Price is currently positioned at the upper boundary of this range, directly on $16. This level now acts as the immediate pivot. Holding above it would suggest continuation within the higher part of the range, while losing it would likely rotate price back toward $15.
Similar setups have been observed in SOFI Stock Trapped Between $16 and $17 as Institutions Stack 161 Million Shares, where concentrated positioning defined price behavior within a narrow band. Broader structural pressure is also reflected in SOFI Tests $13 Support as Bearish Trend Holds Firm, where key levels defined directional bias.
Institutions are not spread across multiple levels - they are concentrated. With price sitting at the top of that concentration, the next move depends entirely on whether the upper anchor holds or gives way.
What stands out is the precision of the current setup. And with price sitting at the top of that concentration, the next move will depend on whether that upper anchor holds or gives way.
 Usman Salis


