 Saad Ullah
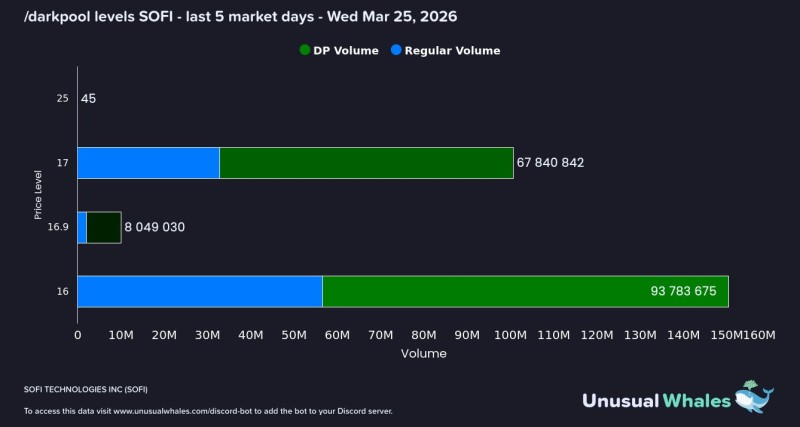
A tightly compressed range is forming in SOFI stock, and institutional activity suggests it may not last long. Dark pool data shows massive accumulation concentrated at two key levels, creating a clearly defined structure for price action. Over 161 million shares were positioned between $16 and $17 within just five trading days, highlighting unusually focused participation from large players.
Where Institutions Drew the Line
The chart confirms two dominant zones. Around $16, approximately 93.8 million shares were accumulated, forming the strongest base. Near $17, another 67.8 million shares were added, creating a clear upper boundary.
This type of behavior is consistent with broader SOFI price action. In SOFI stock support hold at $16-$19 could trigger move to $28, analysts highlight the same zone as a key structural base where price decisions are made.
A Compression Phase With Clear Boundaries
At the current price near $16.65, SOFI stock is effectively trapped between these two levels. This creates a classic range-bound structure where price oscillates without establishing a trend.
Such compression phases often precede expansion. The chart shows no strong breakout attempt yet, meaning both buyers and sellers are waiting for confirmation.
No breakout attempt yet. Both sides are in a waiting game, and that tension has to resolve somewhere.
Recent market context reinforces this idea. After a sharp correction, SOFI has been stabilizing around this region, as noted in SOFI stock falls 50% as valuation resets near $17, where the $17 area emerged as a key decision zone.
The Break That Will Set the Direction
The setup is unusually clean, with two clearly defined institutional levels:
- $16 acting as the primary support with the largest accumulation
- $17 acting as the breakout trigger
A move above $17 would indicate buyers gaining control, potentially shifting structure toward continuation. A breakdown below $16, however, would signal that the strongest support has failed.
This dynamic fits into the broader technical picture. Similar inflection behavior has been observed in SOFI stock tests key Fibonacci support near $18.83, where holding or losing support defined the next directional move.
What makes the current setup notable is the concentration of capital. When institutions commit at specific levels rather than across a range, the eventual breakout tends to carry stronger momentum.
When you see 161 million shares stack this cleanly in five days, the next move is not going to be quiet.
SOFI is not trending. It is compressing. And that usually does not last long.
 Saad Ullah


