 Peter Smith

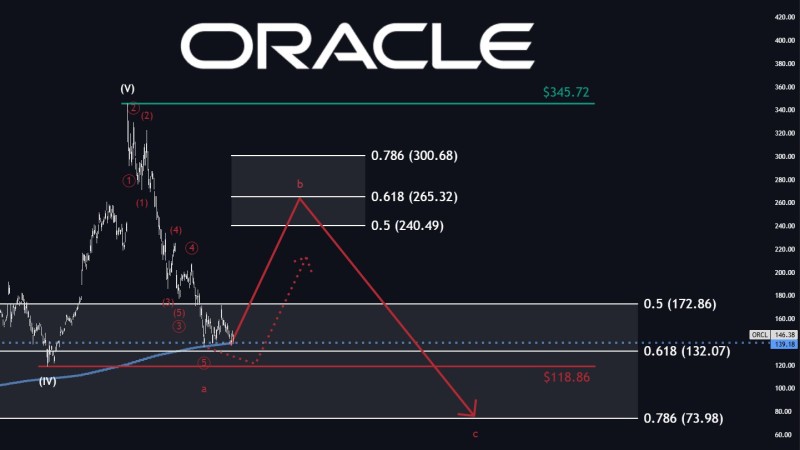
The Analyst flagged the setup, noting the stock has corrected nearly 60% and is now pressing into a range defined by the 200-week moving average near $139 and a lower horizontal support around $118. This area has become the key battleground for what comes next.
The stock has corrected nearly 60% and is now approaching a support range defined by the 200-week moving average near $139 and a lower level around $118.
ORCL Decline That Reshaped the Trend
The chart reflects a sustained downtrend following the peak, with price consistently moving lower after failing to hold higher levels. The structure shows a clear loss of bullish momentum, with the stock transitioning into a prolonged corrective phase.
This kind of extended selloff lines up with what broader technical work on ORCL has been showing. Earlier analysis documented accelerating downside pressure and breakdowns through key levels - most recently when the stock entered oversold territory after losing prior support, as covered in ORCL Stock Slides Further as Oversold Signal Emerges.
Why the $118–$139 ORCL Support Zone Matters
The range between $139 and $118 is directly referenced in the chart as the zone where a potential counter move may begin. The upper boundary aligns with the 200-week moving average, while the lower level marks a clearly defined horizontal support.
Long-term moving averages often act as stabilization points after deep corrections - and this zone is where the next decision gets made.
Long-term moving averages have historically served as stabilization points following major drawdowns. ORCL has been here before - the stock previously found footing near its 200-week average after an extended decline, a dynamic detailed in ORCL Stock Finds Support at 200-Week Average After 61% Drawdown. At the same time, the chart outlines possible upside retracement zones, but these remain conditional on support holding.
The Setup for a 60%–90% ORCL Counter Move
The current structure is framed as a potential starting point for a rebound - not confirmation of a reversal. The key condition is straightforward: price needs to hold within the highlighted support range.
If it does, the setup allows for a meaningful recovery. The projected rebound range of 60% to 90% reflects the scale of the prior decline and the potential for retracement within a corrective cycle. That kind of bounce has precedent in ORCL's own history - the stock recovered sharply after earlier extended selloffs, as documented in ORCL Stock Rebounds 40% From Lows as Shares Bounce Off 200-Day MA.
Whether this area becomes a base or simply a pause will depend entirely on how price reacts within the $118-$139 range.
For now, the structure remains in correction. But the chart defines a clear inflection zone - and how price behaves inside the $118–$139 band will determine whether this is a floor or just a temporary stop on the way lower.
 Peter Smith


