 Eseandre Mordi

⬤ Oracle shares staged a notable technical rebound after a sharp correction wiped out nearly 40 percent from recent highs. ORCL filled its most recent downside gap and turned higher after touching the 200-day moving average late last week. Friday's session produced a clean reversal candle near 220 dollars, with price stabilizing right at long-term trend support.
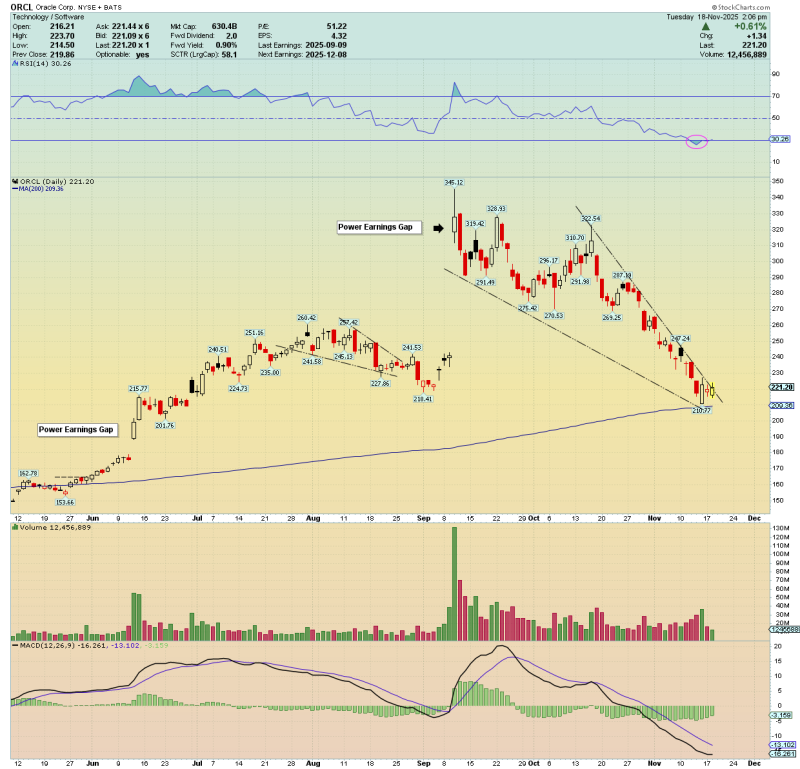
⬤ The chart shows a well-defined descending channel guiding the decline since early October, marked by consistent lower highs and lower lows. The recent touch of 220.77 dollars — the lowest point on the chart — lined up perfectly with the 200-day moving average, a level that historically acts as strong support. Momentum indicators validate the oversold setup: RSI dipped near 30, signaling stretched downside conditions, while the MACD histogram continues to moderate after weeks of accelerating negative momentum. Volume patterns also show increased activity at the reversal point, suggesting renewed interest from dip buyers.
⬤ With ORCL now attempting to break out of the falling wedge pattern, short-term sentiment has shifted toward the possibility of a continued bounce. Potential upside targets sit in the 260 to 270 dollar range, levels that align with prior consolidation zones and breakdown points highlighted by earlier earnings gaps. If the stock maintains support above the 200-day moving average and follows through with additional higher lows, the technical backdrop supports a short-term recovery attempt.
⬤ This development matters because ORCL is reacting at a critical long-term moving average while technical signals show exhaustion in the recent sell-off. A sustained rebound would help ease pressure from the steep correction and could shift short-term market sentiment for large-cap technology names more broadly. The price action around the 200-day moving average will remain the key reference point for judging whether Oracle can rebuild upward momentum after the prolonged decline.
 Eseandre Mordi


