 Marina Lyubimova

⬤ Oracle's stock hit a floor in early February after sliding sharply from its late 2025 highs, finding support near the 200-week moving average. The 61% drawdown from ORCL's September 2025 peak was meaningfully worse than prior corrections - the 2008-2009 crash and the 2022 selloff both topped out around 42-43% before reversing.
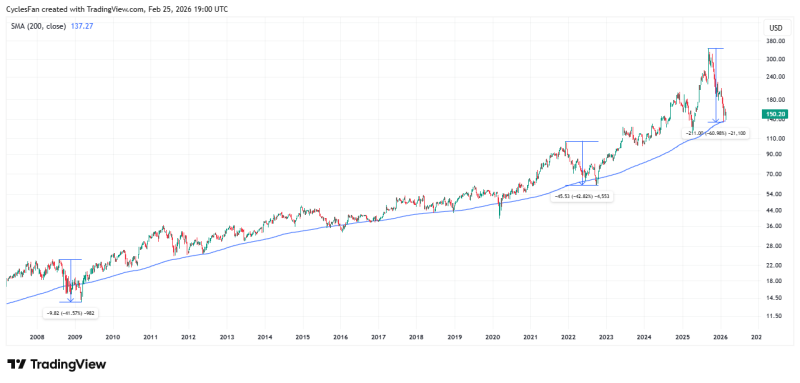
⬤ Looking at the long-term chart, the pattern is clear. Previous corrections were steep but ultimately brief detours within a broader uptrend. This time around, the decline was deeper and more drawn out, driven by intensified selling pressure and a rough second half of 2025 for tech and enterprise software names. The 200-week moving average, sitting near the $137 level, is where the selling finally stalled and early signs of a rebound began to emerge.
⬤ The 200-week moving average is one of the most closely watched long-term technical indicators - it acts as a gauge of structural trend health rather than short-term noise. Historically, bounces off this level after deep corrections have often preceded the next leg higher in a stock's broader cycle. ORCL's recent crash of 45% in 60 days showed just how fast sentiment can shift for even the largest enterprise software companies.
⬤ The fact that the 200-week average is holding after such an extreme 61% decline is notable. It signals that long-term trend support hasn't broken down despite the severity of the move. Traders and analysts will be watching price action around this level closely to determine whether ORCL enters a genuine recovery phase or settles into a prolonged consolidation.
 Marina Lyubimova


