Peter Smith

Nike (NKE) just wrapped up ten consecutive down sessions - the longest losing streak since August 2023. The stock slid from around $64 to the mid-$50s, closing one highlighted session at $54.13, off 2.82%, with a cluster of red candles on the chart that made the sustained weakness hard to ignore.
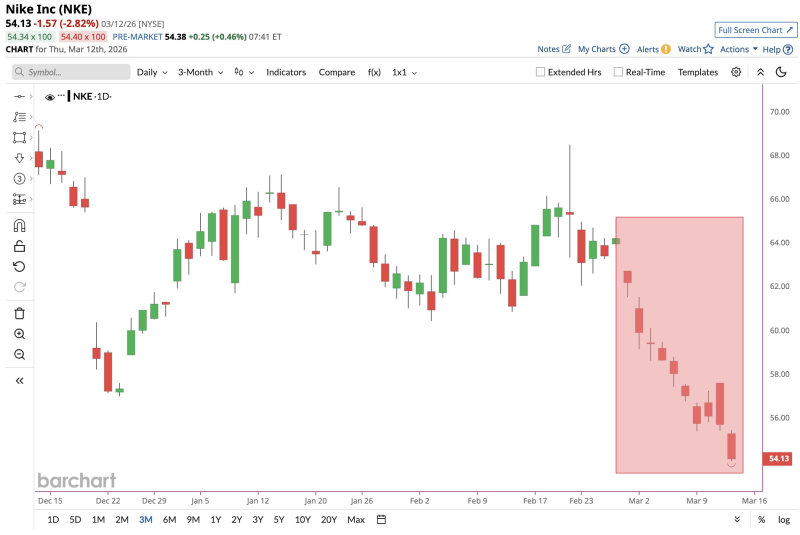
Zoom out to the three-month view and the picture gets clearer. Nike bounced in January and February, but neither rally had legs - prices kept stalling below prior highs, leaving the stock exposed when sellers came back in force. That kind of failed recovery is a classic setup for a deeper leg down, and that's exactly what followed in early March.
The current price zone may represent a key structural level for the stock - early signs of a long-term base forming on the monthly chart.
Still, not everything points lower. Monthly chart analysis suggests NKE may be carving out a long-term base at current levels - a potentially significant floor if it holds. Traders watching the monthly structure argue the mid-$50s could be where longer-term buyers step in.
On the technical side, a double bottom pattern had previously pointed to a $74 target if key resistance levels broke. That scenario now depends on whether buyers can absorb the current selling and stabilize the stock - a reversal of this length in a brand as widely followed as Nike tends to get traders' attention fast.
 Peter Smith