 Artem Voloskovets

⬤ Nike shares are building what could become a significant long-term base on the monthly chart. Right now, there's a left shoulder in place and the first head of the pattern is complete, but the second head and right shoulder haven't formed yet. This means the structure is still a work in progress rather than anything traders can act on confidently.
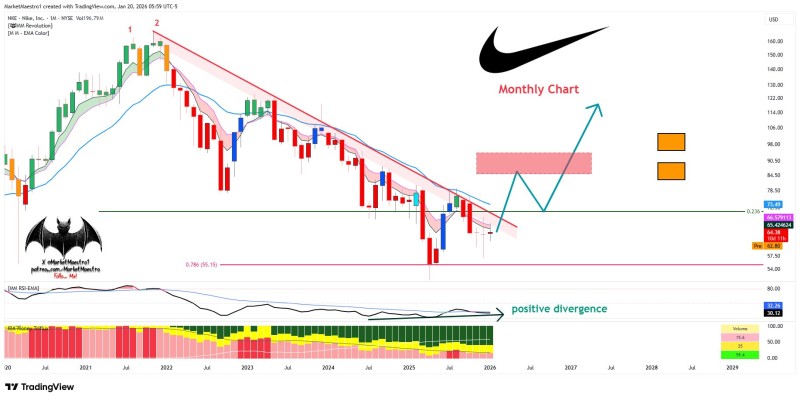
⬤ The stock is currently trading below a long-term downtrend line that's been in control since the highs. Recently though, selling pressure seems to be easing around a solid support level, and the price is holding steady instead of dropping further. Multiple moving averages are still sitting above the current price, which tells you the trend hasn't flipped bullish just yet.
⬤ Momentum indicators are showing something interesting: a positive divergence is forming, meaning momentum is improving even though the price is still near recent lows. The chart suggests Nike could push higher toward a resistance zone marked in red, but that area will likely act as a ceiling and trigger a pullback that forms the right shoulder of this base pattern.
⬤ Why this matters: Nike is a major consumer brand, and its long-term price movement often mirrors wider trends in consumer spending and market sentiment. If the current support holds, it strengthens the case that this level could be a meaningful bottom. Still, until the rest of the pattern develops and Nike breaks above key resistance, the chart is basically saying "wait and see" rather than "all clear."
 Artem Voloskovets


