 Marina Lyubimova

⬤ Nike's stock (NKE) just carved out a textbook double bottom on the charts—a pattern that often marks the end of a downtrend. Here's how it works: price drops to a low, bounces back up, falls to nearly the same level again, then breaks higher. Traders love seeing this setup because it hints that sellers are running out of steam. Right now, the focus is on a $74 target, which lines up perfectly with a volume shelf—basically a zone where tons of shares changed hands in the past. These areas tend to act like magnets for price action.
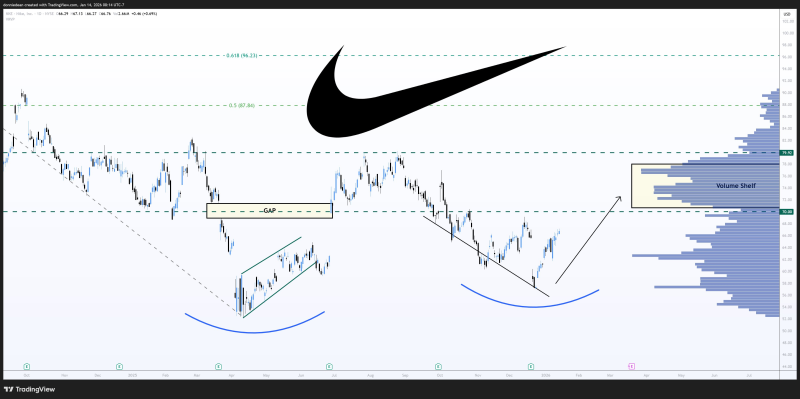
⬤ The key level everyone's watching? $70. That's where Nike keeps hitting a wall. Push through that resistance and we're likely headed straight for $74. But if it can't break through, expect the stock to chop around or even pull back. On the downside, $57 is the safety net. If price drops there, that support level will get tested before any bounce attempt.
⬤ This double bottom suggests the market mood is flipping from bearish to bullish. The $74 target makes sense if momentum keeps building. But here's the thing—$70 needs to crack first. That's the confirmation level. If it holds as resistance, Nike could slide back before making another run at the target. Keep your eyes on that $70 level—it'll tell you everything you need to know about where this stock's headed next.
 Marina Lyubimova


