Peter Smith

Nike shares have entered a critical phase, falling to levels not seen in over a decade. The move reflects a deep and persistent downtrend, with price action continuing to deteriorate and no clear signs of reversal anywhere on the horizon. Barchart highlighted that Nike has now retraced to its lowest price since 2014 - an extraordinary development for a stock that once traded near $180 at its peak.
A Decade of Gains Fully Erased: NKE Returns to 2014 Price Territory
The long-term chart tells a clear story. After topping out in 2021, Nike entered a sustained decline defined by a consistent pattern of lower highs and lower lows.
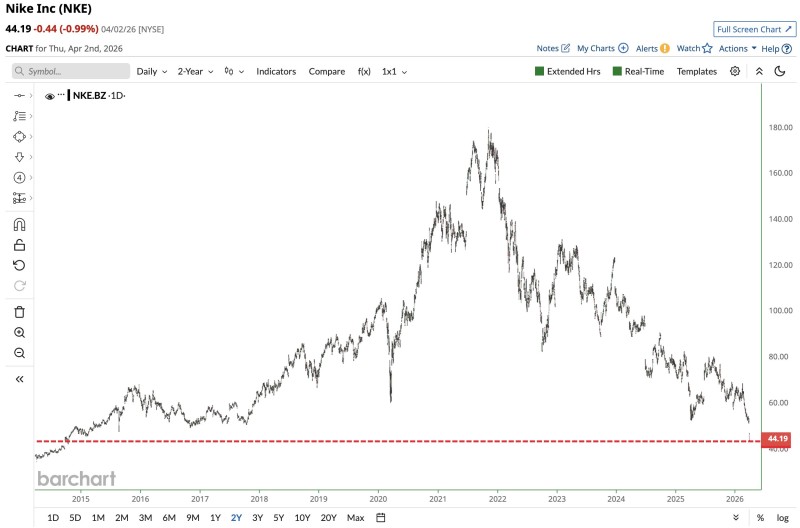
Every recovery attempt failed to reclaim prior resistance levels, reinforcing the broader bearish structure that has been in place for years.
The stock has effectively round-tripped its gains, returning to price territory established more than a decade ago.
What makes the current level significant is not just the size of the drop, but the Nike stock shows early signs of base formation only on the monthly chart - while the shorter-term picture remains firmly bearish. The stock has effectively wiped out the entire multi-year uptrend, returning to where it was when many of today's retail investors were just getting started.
The NKE Breakdown That Never Stabilized
The technical structure has stayed bearish without interruption. Since the 2021 peak, three things have happened consistently:
- Rally attempts have repeatedly stalled below prior highs
- Former support zones have failed to hold when tested
- Downward momentum has continued without forming any clear base
The most recent leg lower pushed the stock beneath the $60 area, which had acted as a temporary floor. Once that level gave way, selling pressure accelerated into fresh multi-year lows.
There is no visible consolidation phase or accumulation pattern forming at current levels. The chart reflects continued weakness, with sellers maintaining control and buyers failing to step in with conviction.
Nike Stock Trend Still Pointing Lower With No Reversal Signals
Despite the magnitude of the decline - from $180 down to 2014 levels - there are very few technical signals suggesting any reversal is underway. The absence of higher lows or any sustained recovery keeps the prevailing trend intact.
Recent price action points to the same pattern playing out repeatedly:
- Bounces are shallow and short-lived
- Selling pressure resumes quickly after brief recoveries
- No clear support structure has formed yet
This type of behavior typically aligns with ongoing distribution rather than a completed capitulation phase - meaning the market has not yet flushed out weak hands entirely.
While some longer-term analyses point to early stabilization attempts in broader structures, the current chart still shows a dominant downtrend. Price is trading well below major resistance zones and has so far failed to regain any upward momentum. Nike's return to 2014 levels is not just a headline number - it confirms a deeply entrenched bearish structure that continues to define the stock's trajectory. For a detailed look at a potential pattern forming on the longer timeframe, see Nike stock forms double bottom: $74 target in sight.
 Peter Smith