Saad Ullah

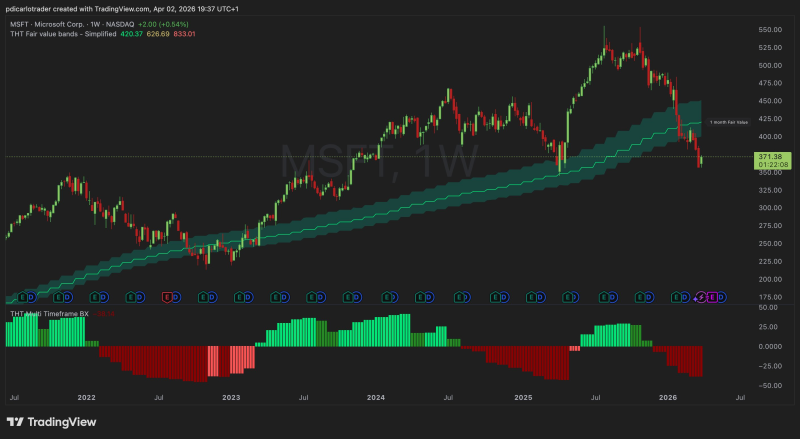
Microsoft's stock is approaching a technically significant inflection point, with price pulling back into a long-term support zone while momentum remains weak. The weekly chart shows MSFT declining from above $520 toward the mid-$300s, aligning with a region that has repeatedly acted as institutional support. As Peter DiCarlo noted, the setup is not yet actionable - but it is increasingly difficult to ignore.
The MSFT Pullback That Reset the Structure
The chart reflects a clear transition from expansion to correction. After printing highs above $520-$540, MSFT stock rolled over and entered a sustained decline, forming lower highs along the way. This shift marks a break from the prior trend rhythm, where pullbacks were shallow and quickly bought.
After printing highs above $520-$540, MSFT rolled over and entered a sustained decline - a break from the prior rhythm where pullbacks were shallow and quickly bought.
Price is now trading near $370, a level that closely aligns with long-term support zones identified across multiple technical frameworks - and with a significant pullback from highs above $550 now fully established on the weekly chart.
Where MSFT Long-Term Support Is Being Tested Again
What stands out in the chart is the interaction with the rising fair value band. This zone has consistently acted as dynamic support throughout the broader uptrend, with price respecting it across multiple cycles.
The current test carries weight for several reasons:
- Price is approaching a zone with a history of strong rebounds
- The broader uptrend remains technically intact above this region
- The structure has not yet broken into a full trend reversal
Microsoft Tests Key $380 Support as Forward P/E Drops to 22x captured the earlier stage of this support test, showing how valuation and technical levels are now converging in a way that is drawing institutional attention.
The Momentum Signal That Has Not Flipped Yet for MSFT
Despite the constructive positioning near support, momentum remains a limiting factor. The lower panel on the chart shows the monthly signal still in negative territory - price is stabilizing, but not yet reversing. That distinction is critical.
Stabilization suggests buyers are present - but a confirmed trend shift requires momentum to flip alongside price, and that has not happened yet.
Microsoft Tests $350 Support Zone With Oversold Weekly Signal reinforces the same tension playing out at a slightly lower level, where oversold readings exist but confirmation remains absent. Microsoft Stock Hits Gap Zone at Key Technical Level adds another layer to the picture, showing how gap zones are now overlapping with the same support cluster that the weekly chart is currently testing.
MSFT sits at a crossroads - long-term support structure is holding, but without a shift in momentum, the setup remains incomplete.
For now, MSFT stock remains at a crossroads where the long-term support structure is holding but the momentum signal has not yet confirmed a turn. Traders are watching closely for the moment when price and signal finally align - because historically, when that happens in this zone, the moves that follow have been significant.
 Saad Ullah