 Saad Ullah

AST SpaceMobile is doing what it has done repeatedly over the past few years - pulling back into a well-defined support zone and holding. Analyst Fibby. points out that the stock continues to respect both Fibonacci levels and the EMA cloud, a combination that has defined its bullish structure for years and keeps higher targets squarely in play.
The confluence area sitting between roughly $70 and $80 - where the 0.5 and 0.618 Fibonacci retracement levels overlap with the EMA cloud - has functioned as a consistent floor throughout previous corrections. Buyers keep showing up at the same spot, and that kind of repetition matters in technical analysis.
Price is holding above a critical Fibonacci and EMA confluence zone, confirming that buyers continue to defend the same area that has supported the uptrend historically.
ASTS Support Zone Keeps the Long-Term Trend Intact
What makes the current setup compelling is not just that price is above support - it is how it is getting there. Each pullback into the EMA cloud has resolved with stabilization rather than breakdown, building a track record of higher lows that defines the broader trend.
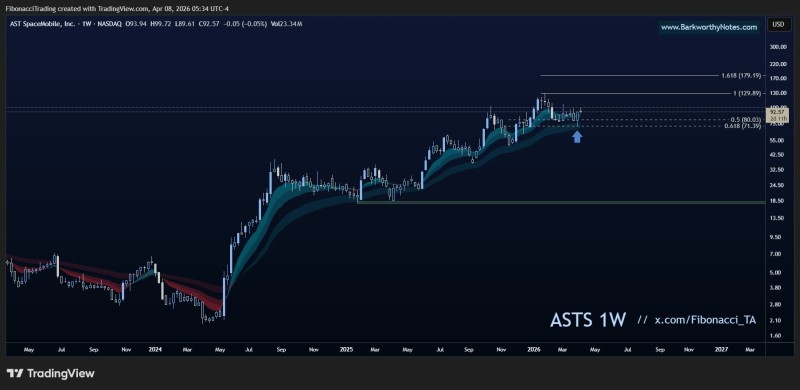
The current consolidation follows that exact same script. Price is not collapsing, it is grinding sideways and attempting to build a base. That behavior looks far more like continuation than reversal, which is an important distinction for anyone watching ASTS stock with $129-$179 upside targets in view.
The formation of consistent higher lows over time is the defining feature of this chart - each correction into the EMA cloud has produced stabilization, not a breakdown.
Why ASTS Stock Targets $129 and $179 From Here
With support holding, the conversation naturally shifts to where price could go next. The chart highlights two levels: $129 and $179, both derived from Fibonacci projections rather than picked at random. They align with previous technical extensions and reflect the natural upside continuation when the support zone stays intact.
The broader picture supports this read. $3.5M in whale flow piled into $100 calls over three weeks, suggesting institutional participants are positioning for a move higher rather than bracing for a breakdown.
It is also worth noting that there is currently a roughly $10 gap between ASTS stock price and institutional demand levels, a dynamic that often resolves in favor of the demand zone pulling price back upward.
If the EMA cloud and Fibonacci support hold, the long-term uptrend stays valid - and continuation toward $129 and then $179 becomes the higher-probability scenario.
The One Condition the ASTS Structure Depends On
None of the upside targets matter if the support zone fails. The EMA cloud and Fibonacci levels together form the foundation of everything described above. Break that floor, and the pattern that has defined ASTS for years breaks with it.
As long as price remains above this area, the trend stays intact:
- Support zone: $70 - $80, defined by 0.5 and 0.618 Fibonacci retracements and EMA cloud
- First target: $129, aligned with Fibonacci projection extensions
- Second target: $179, the upper continuation objective under the bullish scenario
- Key risk: A decisive close below the support zone would invalidate the current structure
The setup is straightforward - the trend has been consistent, the support levels are well-defined, and the targets are technically grounded. What happens at the $70-$80 zone in the sessions ahead will likely determine whether the next leg higher is already underway.
 Saad Ullah


