 Usman Salis

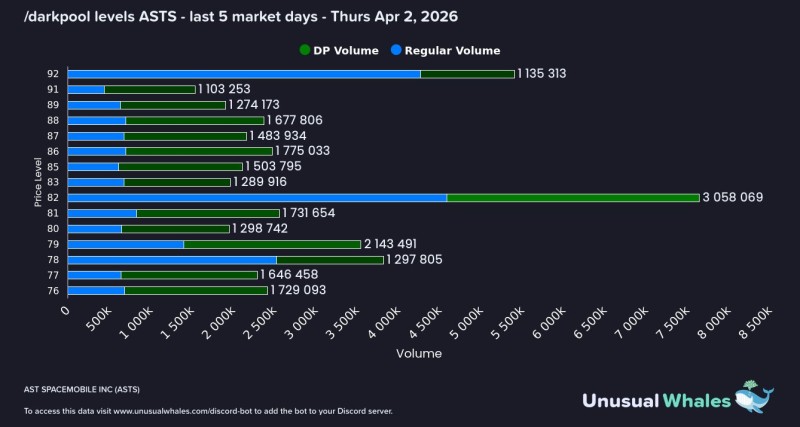
After weeks of rising institutional floors, the structure around ASTS stock has shifted. Accumulation has moved lower even as price continues to hold near the upper range - a divergence worth watching closely. Analyst Fibby. flagged the shift, noting that the dominant dark pool level has now reset to $82, where roughly 3.1 million shares have changed hands.
The shift that ended the rising floor pattern in ASTS
The chart shows a clear break in trend behavior. After three consecutive weeks of higher institutional floors, demand has moved back down into the $79-$82 range.
This marks a pause in the prior pattern of higher support levels.
After three consecutive weeks of higher institutional floors, demand has now moved back down into the $79-$82 range - a reset that changes how the chart reads.
Instead of continuing to step higher, institutions have repositioned lower, concentrating activity at new levels. The prior upward drift in support has stalled, and the structure now reflects a deliberate pullback in where big money is willing to engage.
Where institutional demand is now focused
The chart highlights a clear hierarchy of accumulation across three key price levels:
- $82: roughly 3.1M shares (strongest demand)
- $79: roughly 2.1M shares
- $86: roughly 1.8M shares
This creates a widened institutional zone between $79 and $82, with $82 acting as the primary anchor. Unlike previous weeks where demand climbed steadily, the structure now reflects a reset lower. This aligns with broader price behavior, where ASTS has recently traded within a defined $75-$95 range and struggled to extend higher - oscillating between support and resistance without a clean directional break.
A $10 gap that changes the ASTS stock structure
With price near $92, there is now a roughly $10 gap between current trading levels and the heaviest institutional demand. This gap is critical - it represents the distance between where institutions are accumulating and where price is currently positioned. A similar dynamic played out when AST SpaceMobile held the $70-$80 buy zone with eyes on a $130 target, where support zones acted as magnets during pullbacks.
The $82 level acting as a magnet below price
The $82 level now stands as the key reference point. It holds the highest concentration of institutional volume and sits well below current price. If $92 fails to hold, this level becomes the most likely downside target, acting as a magnet due to the volume concentration beneath the market.
Holding above current levels keeps the broader trend intact, with upside projections extending toward $130 - but the $82 zone remains the line in the sand below.
At the same time, holding above current levels keeps the broader trend intact. The chart suggests that continuation above $92 could open the path toward higher levels. This type of structure - where price compresses above support while testing resistance - has also been reflected in how ASTS stock tested its 50-day moving average as SpaceMobile eyed a 56% breakout toward $150, where consolidation preceded expansion attempts.
ASTS is now positioned between elevated price and lower institutional demand, with the next move likely defined by whether current levels hold or price gravitates back toward the $82 accumulation zone.
 Usman Salis


