 Eseandre Mordi

AST SpaceMobile (ASTS) is holding its ground above $92 after pulling back into a well-defined support zone, with the overall trend structure remaining undisturbed. According to Fibby., both the EMA cloud and the 0.618 Fibonacci level held through the dip, confirming that bulls remain in control on the weekly timeframe.
The ASTS Dip That Found Strong Support
The chart shows ASTS pulling back from recent highs into a support band between roughly $71 and $80.
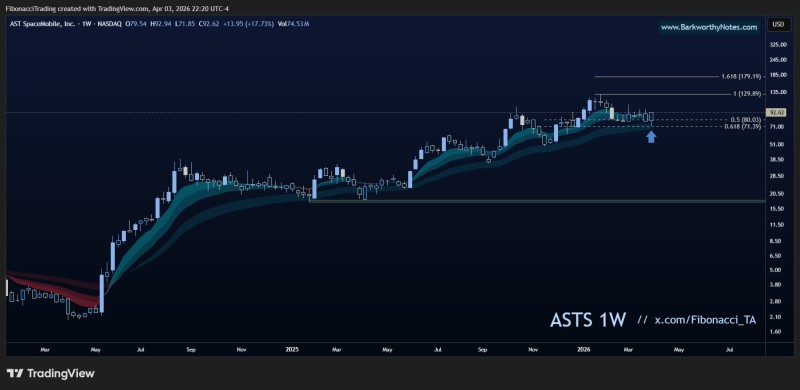
This zone aligns with the 0.618 Fibonacci retracement and the EMA cloud, creating a confluence area where buyers stepped in with conviction.
The EMA cloud and 0.618 Fibonacci level held, confirming that the trend remains intact.
The reaction from this level reinforces its importance. Price did not break below support but instead stabilized and pushed higher, maintaining the structure of higher lows that has defined the current trend.
Why the $92 ASTS Close Is a Key Signal
Closing above $92 suggests that buyers regained short-term control after the pullback, preventing a deeper correction from developing. This behavior is consistent with what ASTS Stock Stuck in $75–$95 Range as Breakout Remains Elusive has outlined - the $92 level represents the upper boundary of the recent range, and holding above it carries weight.
The chart reflects a market that:
- Held the 0.618 retracement level
- Found support within the EMA cloud
- Maintained the broader uptrend structure
Both price structure and key technical indicators point toward continuation rather than breakdown.
This combination supports the view that the pullback was corrective rather than a trend reversal.
ASTS Targets: $129 and $179 in Focus
With support holding, attention shifts to the upside levels marked on the chart. The first target sits near $129, while a higher extension is projected around $179. As covered in AST SpaceMobile Holds $70–$80 Buy Zone, Eyes $130 Target, sustained support within the $70–$80 zone has consistently pointed toward upside continuation scenarios in that $130–$180 range.
As long as price holds above the key support zone, dips remain opportunities within the current structure rather than signs of weakness.
The ASTS Uptrend That Remains in Control
The chart does not show signs of structural weakness. A broader look at ASTS Stock Tests 50DMA as SpaceMobile Eyes 56% Breakout Toward $150 reinforces the same picture - ASTS has repeatedly respected this support zone while staying inside an upward trend structure.
ASTS is not breaking down. It is consolidating within strength, and the next move will depend on whether momentum can build from this base toward the upper targets.
 Eseandre Mordi


