 Alex Dudov

AST SpaceMobile shares are sitting at a pivotal technical crossroads. After recovering from lows near the $78 Fibonacci support zone, ASTS has clawed its way back into the $95-$100 range and is now pressing directly against the 50-day moving average. The market is watching whether bulls can push through or whether rejection extends the consolidation.
50DMA Compression Sets Up Make-or-Break Moment for ASTS
The chart structure tells a story of tightening range. ASTS bounced off the 0.618 Fibonacci level at $78 and has since printed a series of higher lows, all while trading beneath a descending trendline. That combination creates a classic compression: rising support meets static overhead resistance. Price is being squeezed, and something has to give.
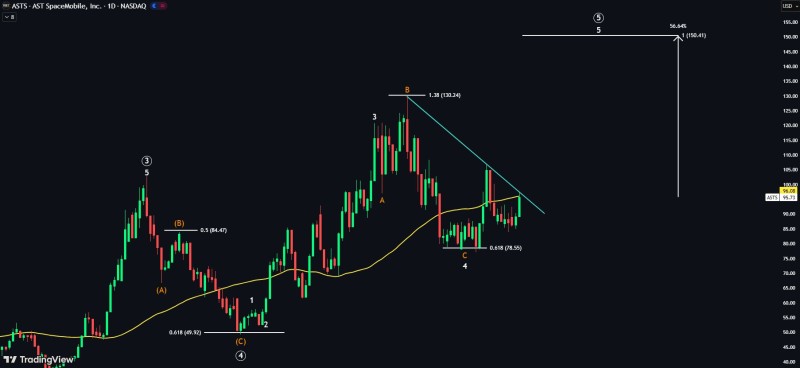
The 50DMA is the level bulls need to reclaim. A clean break above it would represent the first meaningful shift in short-term structure since the pullback began, opening the door to momentum continuation. Rejection, on the other hand, risks extending the sideways grind and cooling near-term sentiment.
Wave 5 Target at $150 Backed by Prior ASTS Breakout History
The broader Elliott Wave count on the chart identifies the current phase as a corrective structure that may be wrapping up. If the pattern plays out, the next impulsive leg could carry ASTS roughly 56% higher toward the $150 area, aligning with prior highs and the chart's marked projection.
This kind of setup is not new for ASTS. The stock has a track record of sharp technical expansions tied to fundamental developments. ASTS stock surges on satellite deal momentum documented how quickly price can accelerate once a catalyst aligns with technical structure. Similarly, ASTS breakout setup signals continuation toward highs showed that breakout confirmation tends to trigger rapid expansion rather than a gradual grind. And as covered in AST SpaceMobile rally driven by telecom partnerships, structural catalysts have historically synchronized with technical turning points in this name.
The current setup offers a defined risk framework: the 50DMA marks the line between continuation and extended consolidation. Compression phases like this typically precede elevated volatility, and the next directional move in ASTS could be the one that matters.
 Alex Dudov


