 Usman Salis

AST SpaceMobile is back on traders' radars after defending a critical support zone on the two-week chart. The stock has been consolidating above the $70-$80 Fibonacci retracement band - a level that technical analysts are treating as a potential launchpad for the next leg higher. With satellite broadband demand growing and the company's commercial rollout gaining traction, the technical picture is starting to align with the fundamental story.
$70-$80 Fibonacci Zone Is the Key Support Level to Watch
Technical analysis of the ASTS 2-week chart identifies the $80 and $70 levels as the primary buy zone. The 0.5 retracement sits near $80.03, while the 0.618 level comes in around $71.39 - both zones where buyers have historically shown up during pullbacks. As long as price holds above this range, the broader uptrend structure stays intact.
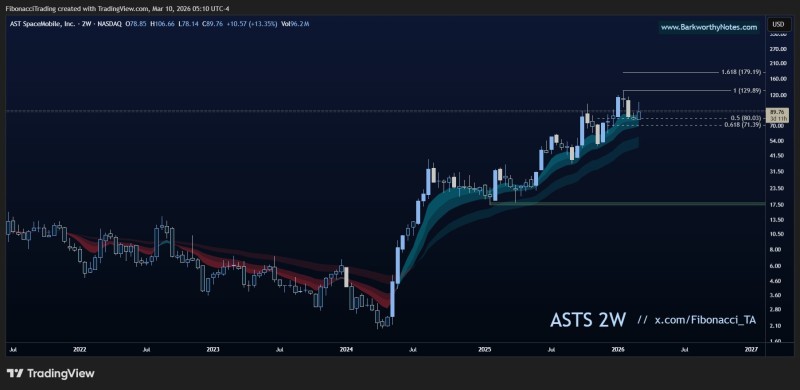
The first upside target sits at the 1.0 Fibonacci extension near $129.89, with a more ambitious projection at the 1.618 level around $179.19. ASTS previously traded above $100 before pulling back, and reclaiming that level would be a meaningful early signal that bulls are regaining control.
Can ASTS Momentum Rebuild From Current Levels?
Recent market commentary points to ASTS trading inside a defined range while its longer-term trend framework stays intact. The stock has seen periods of consolidation after last year's sharp rally, but the two-week chart suggests the correction may be maturing. AST SpaceMobile previously held a rising channel near $82 ahead of earnings, underlining how the $80 area has repeatedly acted as a floor.
Whether ASTS can push toward $130 will depend on momentum rebuilding above the key weekly levels. Sustained price action above the $70-$80 zone keeps the Fibonacci extension targets in play. A decisive break below $70, however, would shift the technical picture and require reassessment of the current setup.
 Usman Salis


