Alex Dudov

AST SpaceMobile is approaching a technically decisive moment. After months of compression following its sharp rally, the stock is now stabilizing within a clearly defined range. The Long Investor noted that holding between $22 and $26 could set the stage for a strong upside move - and the chart structure aligns with that scenario.
ASTS Stock Structure Built on Compression
Following its surge toward the $39 region, ASTS entered a prolonged consolidation phase marked by lower highs and tightening price action. Rather than a sharp reversal, the stock has been forming a controlled structure, with descending resistance pressing from above.
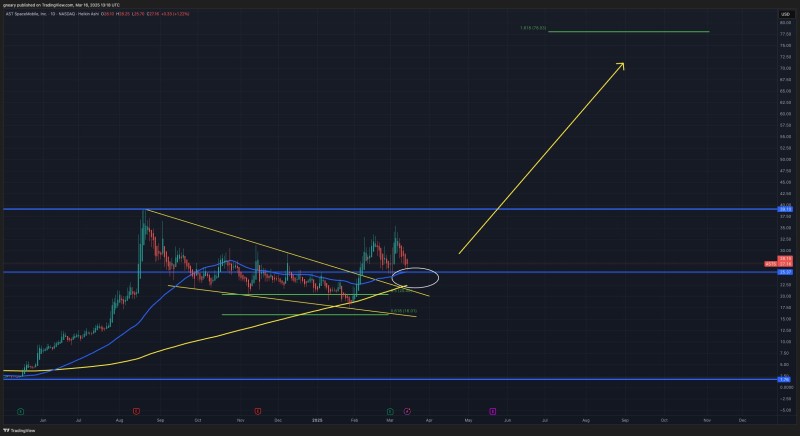
At the same time, price has consistently found demand within the $22-$26 range. This repeated interaction has established the zone as a key structural base, where buyers have stepped in to prevent deeper downside. As the analyst put it:
Price has consistently found demand within this range, establishing it as a key structural base where buyers continue to step in.
This type of tightening formation reflects a market in balance, where neither side has taken full control - often a precursor to expansion.
Why the $22-$26 Range Defines the Next ASTS Move
The $22-$26 area is not just another support band - it is the foundation of the current structure. Price is now testing this zone again after pulling back from a recent local high.
The chart also shows price interacting with a key moving average in the same region, reinforcing its importance. As long as ASTS holds above this area, the structure remains intact and constructive. According to the analysis:
As long as price holds above this area, the structure remains intact - this is where the next directional move will be decided.
This behavior mirrors broader technical patterns seen in ASTS, where consolidation phases often precede directional moves. Recent analysis highlighted how the stock can remain range-bound before attempting a breakout toward higher levels.
The ASTS Setup That Could Trigger Expansion
What makes this setup compelling is the alignment of multiple technical factors within a compressed range:
- Descending resistance limiting upside attempts
- Horizontal support repeatedly holding near $22-$26
- Price coiling into a tighter structure
This combination creates a classic breakout setup. If support continues to hold, the pressure from compression can resolve into a strong directional move:
The compression building within this range is exactly the kind of setup that can resolve into a sharp directional move once one side takes control.
Similar setups have been observed in ASTS before, where holding key zones allowed price to stabilize before pushing higher within larger trend structures. ASTS stock previously tested its 50DMA while eyeing a 56% breakout toward $150, and more recently found itself stuck in the $75-$95 range as a larger breakout remained elusive.
The chart projection points toward a significant upside path, but that scenario remains conditional. The structure depends entirely on whether buyers can continue defending the current range.
For now, ASTS stock is in a holding pattern - but one that may not last much longer.
 Alex Dudov