 Marina Lyubimova

⬤AST SpaceMobile is back on traders' radar after fresh technical analysis suggested the stock could keep oscillating in a wide corrective range. The current outlook points to continued price action between $20 and $50 before any real push toward a new all-time high materializes.
⬤A move all the way down to $20 is viewed as an outlier scenario, but the chart still allows for it. The level to watch is the 200-week moving average sitting near $23, which could become a critical long-term floor if selling pressure picks up again. That support layer lines up with the broader corrective structure visible across multiple timeframes.
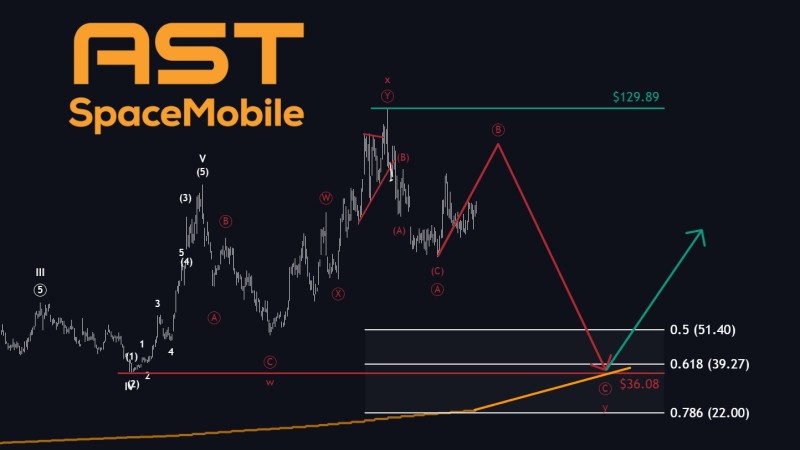
⬤Fibonacci retracement levels add another layer to the picture. The 0.618 level lands near $39, creating a potential confluence zone if the stock slides further. A possible ABC corrective wave pattern on the chart targets the $36 area as a pivot before any recovery attempt, suggesting ASTS has not necessarily bottomed yet. Investors tracking AST SpaceMobile's $1B+ contracted revenue story may want to wait for stabilization in this zone before acting.
⬤Recent price action underscores the volatility: ASTS has logged sharp pullbacks after losing key levels and wide consolidation windows across different timeframes. Still, the longer-term technical structure has not broken down. The $70-$80 buy zone with a $130 target thesis remains intact for bulls who believe the correction is transitional rather than a trend reversal.
⬤The core question for traders is whether ASTS has already found its floor or needs one more leg down to complete the correction. A confirmed hold in the $23-$39 zone would be a meaningful signal for renewed upside momentum. Failure to stabilize there could extend the choppy phase well before any run at fresh all-time highs.
 Marina Lyubimova


