 Saad Ullah

⬤ Something unusual is happening beneath the surface of the US stock market. While the SPY S&P 500 trades just 2% below its record peak, more than 115 individual companies within the index have plunged at least 7% in a single session over the past eight trading days. According to Mike Investing, this kind of internal breakdown rarely shows up except during periods of serious market stress.
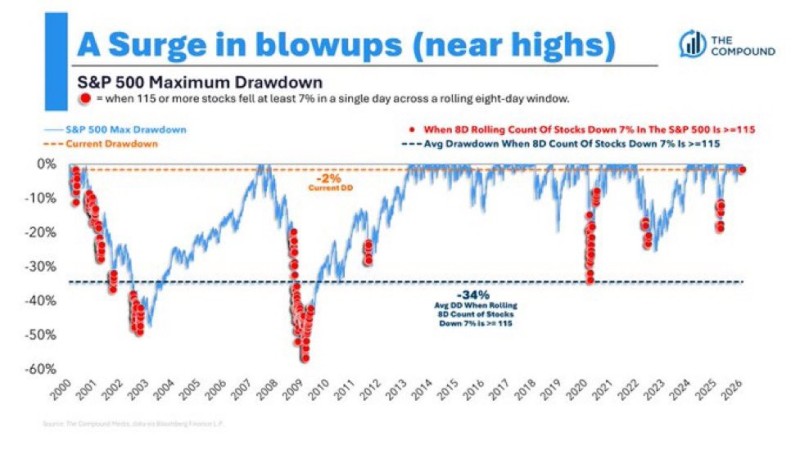
⬤ The pattern looks eerily familiar to anyone who lived through previous crashes. When this breadth breakdown appeared in the past, the S&P 500 suffered an average maximum drawdown of around 34%. The chart highlights clusters around three major crisis periods: the 2000 dot-com bubble burst, the 2008 financial meltdown, and the March 2020 pandemic collapse. What makes the current situation striking is the disconnect—the headline index looks fine while individual stocks are getting hammered. This same kind of deterioration appeared in earlier warnings about S&P 500 breadth drops to 51% and bearish breadth regime indicators, where weakening participation hid beneath stable index prices.
The key observation is the contrast between strong headline index levels and widespread internal declines.
⬤ The tracking data shows red markers lighting up whenever 115 or more stocks drop 7% within an eight-day window, plotted against the index's drawdown history. Recent signals have clustered closely together, yet SPY continues to hold near all-time highs—a divergence also discussed in SPY dip buying signals analysis.
⬤ What matters here isn't just the index level, but what's happening underneath. When individual stocks start breaking down this widely while the index stays calm, it typically signals a shift in market structure. History suggests these internal cracks tend to spread before they show up in the headline number—and by then, the damage is already done.
 Saad Ullah


