 Saad Ullah

⬤ SPY, the SPDR S&P 500 ETF, is trading near 662 on the weekly chart after pulling back from highs around 690. The latest candle shows a sharp red bar as price moves toward potential support. A deeper slide to the 650 zone could provide the reset the trend needs before buyers step back in.
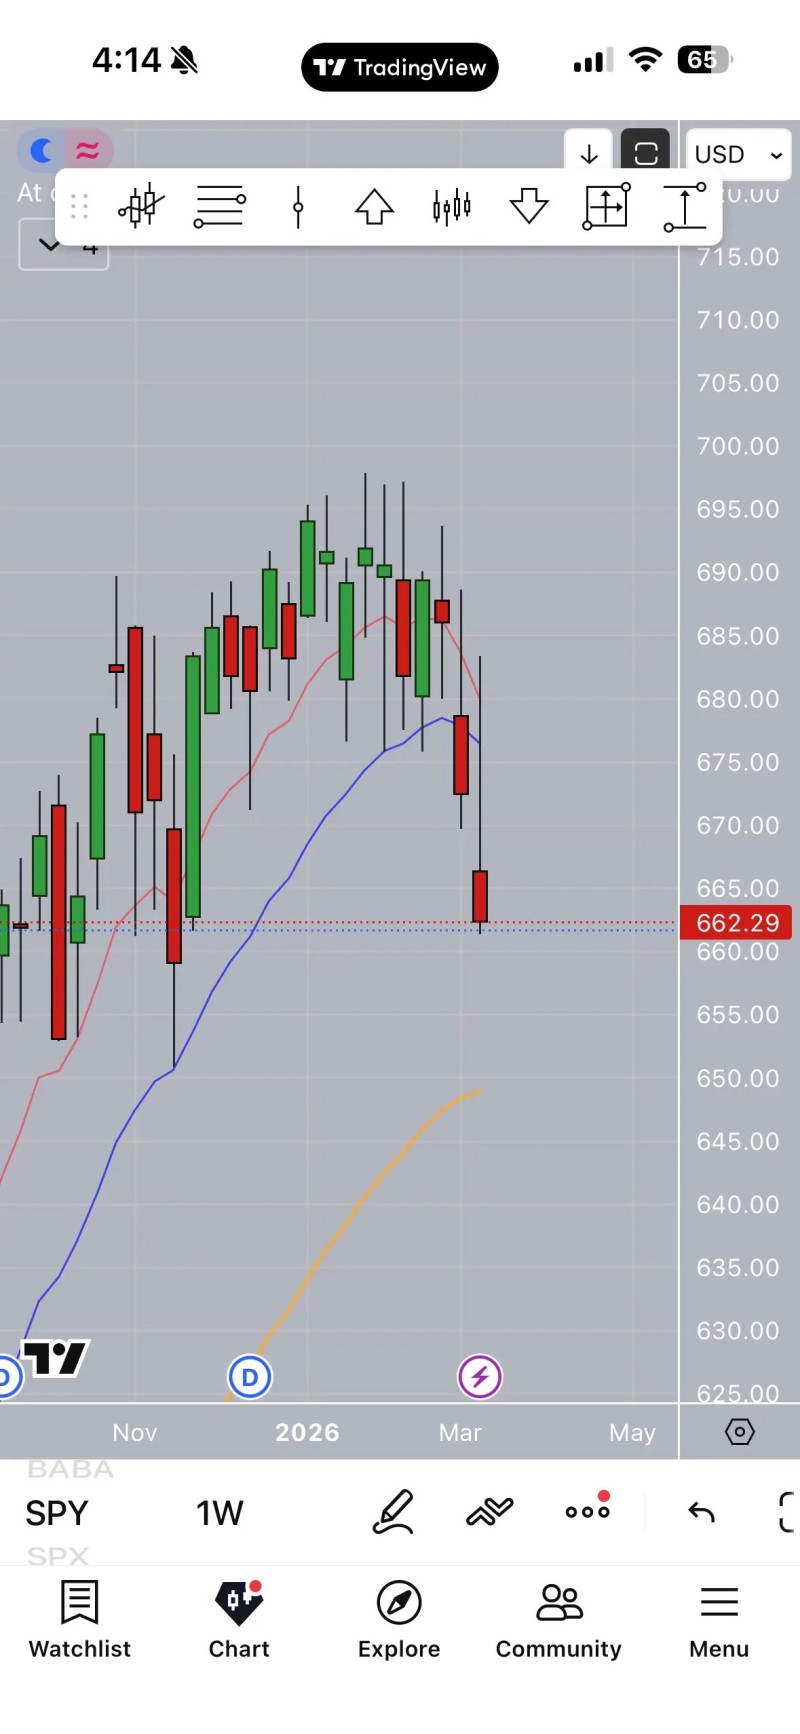
⬤ The weekly candle is drawing attention for a reason. The structure currently resembles an inverted hammer, a pattern that can flip bullish if confirmed in the following week. SPY was trading above key moving averages before this drop, and the 650 level now sits in focus as a zone where those trend indicators may attract demand.
⬤ Recent coverage reinforces that SPY declines often play out as corrective phases, not reversals. SPY Drops to $666-$674 Support Zone: Elliott Wave Analysis Shows Pullback Nearing End frames drops into technical zones as opportunity setups. SPY Pullback Hits Support at $678 as Elliott Wave Structure Holds notes that controlled pullbacks tend to develop within ongoing uptrends rather than signal their end.
⬤ If price stabilizes around 650, the setup points toward a recovery and potential advance toward 777 by end of summer. S&P 500 Tests $690 Resistance As Price Consolidates Near Highs shows how repeated tests of overhead resistance often lead to consolidation before the next leg higher. How price behaves around current support will determine whether that scenario plays out.
 Saad Ullah


