 Eseandre Mordi

⬤ The S&P 500 ETF (SPY) is currently consolidating beneath a well-defined resistance level after rebounding strongly from November lows. Price is trading near $683.17, while multiple recent highs have stalled around the $688 to $690 zone. This consolidation pattern has traders questioning whether the market is preparing for another leg higher or if resistance will hold.
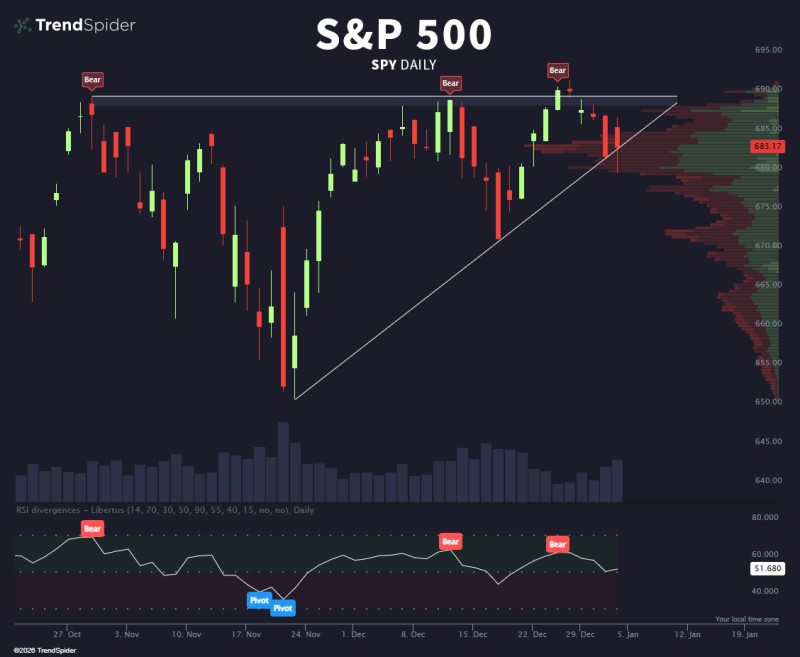
⬤ The chart shows a rising trendline connecting higher lows since late November, forming a tightening structure as price approaches resistance from below. Several peaks near the resistance zone show bearish divergences on the RSI indicator. The RSI reading sits near 51.68, well below earlier highs, suggesting momentum is fading. Volume profile data reveals heavier participation slightly below current prices, indicating strong price acceptance in this zone.
⬤ SPY has recovered from a sharp pullback but now faces repeated rejection near the same resistance band, reinforcing that level as a key ceiling. The rising trendline remains intact beneath price and continues providing structural support. RSI indicators also show earlier pivot points and additional bearish divergence signals as the index approached the upper boundary of the range.
⬤ This setup matters because SPY serves as the primary benchmark for US equity market sentiment. Consolidation near resistance often precedes a directional breakout. If the rising trendline holds, SPY could continue trading near elevated levels while the market digests macroeconomic data and earnings reports. A decisive move away from this range would provide clearer signals about broader risk appetite and whether the recent recovery in US stocks has staying power.
 Eseandre Mordi


