 Saad Ullah

⬤ SPY has dropped into a well-defined support area near $678 after pulling back from highs above $690. The price remains comfortably above critical long-term support levels, suggesting the broader upward structure is still in place.
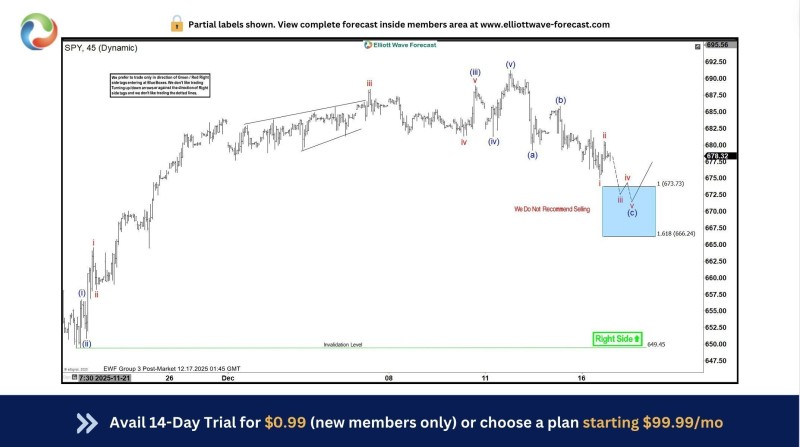
⬤ The pullback landed in a blue box zone marked by Fibonacci levels between $666.2 and $673.7—a typical landing area for corrective waves in Elliott Wave analysis. The chart specifically notes this isn't a selling zone, indicating the decline is likely just a breather in the larger uptrend rather than a reversal signal.
⬤ SPY is trading well above the $649 invalidation level, which would cancel the bullish wave count if broken. The pullback showed controlled, overlapping price action—classic signs of a correction rather than the start of a new downtrend.
⬤ These types of orderly pullbacks can actually stabilize the market after big rallies. How SPY behaves from this support zone could set the tone for U.S. stocks in the near term and determine whether the broader uptrend can keep rolling.
 Saad Ullah


