Usman Salis

The S&P 500 is sending a clear technical signal as it continues to trade below one of its most important long-term indicators. The latest stretch marks an extended period of weakness, reinforcing that the broader structure has yet to stabilize.
The 11-Session Streak That Signals Persistent Weakness in SPX
As Barchart noted, the S&P 500 has now closed below its 200-day moving average for 11 consecutive sessions - the longest stretch since April-May 2025.
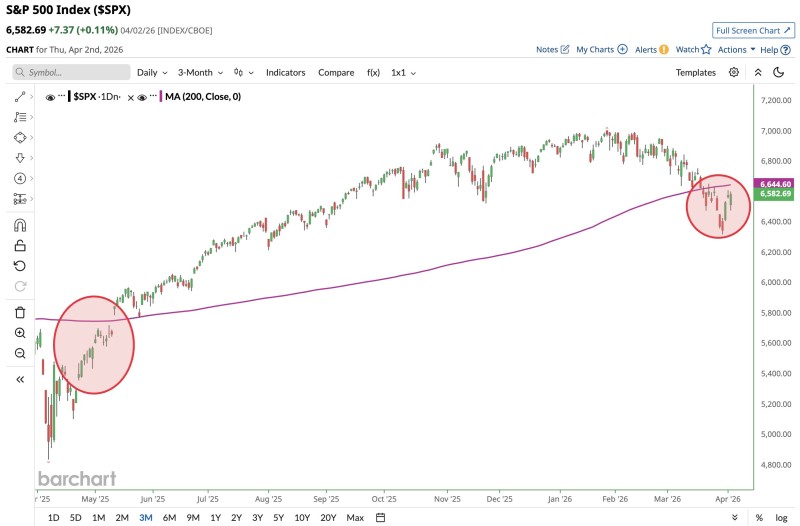
The chart confirms this behavior, showing price consistently trading beneath the rising 200-day moving average, which is positioned near the 6,640 area. Despite multiple attempts to recover, each rebound has failed to reclaim this level, keeping the index structurally below its long-term trend line.
Time spent below the 200-day moving average often reinforces the bearish signal, not just the initial break itself.
This extended duration matters in technical analysis. The longer the index stays below this key threshold, the more weight that reading carries for traders watching longer-term trend direction.
S&P 500 Structure Shifts From Trend Support to Overhead Pressure
The broader structure on the chart reflects a transition away from the prior uptrend. After advancing steadily through 2025, the index began to lose momentum near recent highs and shifted into a pattern of lower highs.
The 200-day moving average, which previously acted as support, is now functioning as resistance - a shift that changes the character of the market structure entirely.
Price is currently hovering in the 6,500-6,600 range, repeatedly rejecting attempts to move back above the long-term average. This aligns with a broader pattern seen in recent S&P 500 technical analysis, where the loss of the 200-day moving average signals a potential shift in the long-term stock market trend.
Compression Without Reversal: SPX Stalls Near 6,400-6,640 Range
Recent price action shows a short-term bounce from the lower range near 6,400, but the recovery lacks strength. Candles remain clustered below the 200-day moving average, indicating that buyers have not yet regained control. Key structural elements visible on the chart include:
- Price holding below the 200-day moving average near 6,640
- Repeated rejection of recovery attempts into that level
- A sequence of lower highs following the peak
This type of setup often reflects a market in transition rather than one that has confirmed a reversal. Similar conditions - where price compresses beneath the 200-day moving average - have been associated with tightening downtrends and unresolved direction.
The S&P 500 is not breaking down aggressively, but it is also failing to reclaim its defining trend level - and that distinction matters more the longer it holds.
For now, the signal remains consistent. The longer this stretch continues, the more the 6,640 line above becomes the level that dictates what comes next for the broader S&P 500.
 Usman Salis