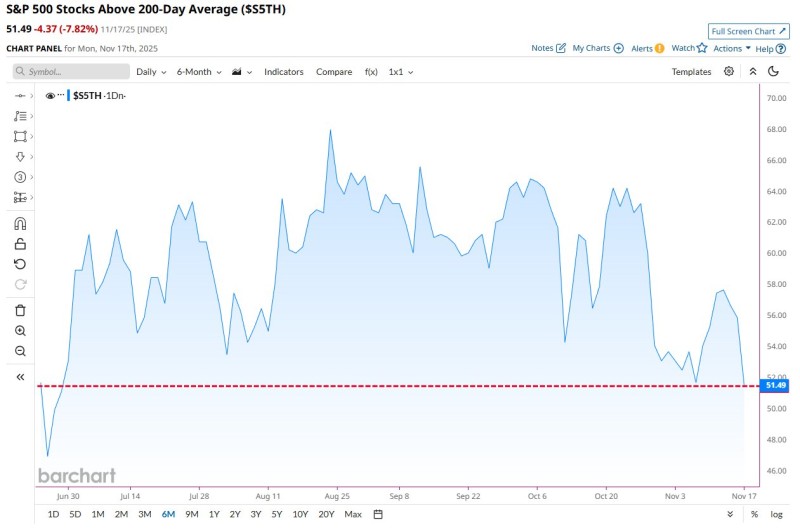
The S&P 500 may look stable on the surface, but cracks are forming underneath. Market breadth – a key measure of how many stocks are actually participating in the rally – just hit its weakest level since June. This divergence between what the index shows and what's happening beneath the hood is raising red flags for traders watching internal market health.
Weak Market Participation Hints at Rising Fragility
A warning sign just emerged beneath the U.S. equity market. Only 51.49% of S&P 500 stocks are trading above their 200-day moving average – the lowest in five months.

While the index looks calm on the surface, fewer stocks are actually participating in the trend. This narrowing base could signal that broader momentum is weakening.
Chart Analysis: Breadth Slides Toward Critical 50% Zone
The chart (ticker: $S5TH) shows the decline clearly. The current reading sits at 51.49%, down 7.82% on November 17. That marks a five-month low, revisiting levels not seen since early summer. A red reference line hovers slightly above at around 52%, highlighting how close the indicator is to a key threshold.
Over the past six months, breadth bounced between roughly 48% and 66%. The latest drop pushes it toward the lower end of that range, showing a real deterioration in participation. Since early October, the chart has traced a pattern of lower highs, culminating in this recent slide back toward the red line.
Why Breadth Is Weakening
Several factors are behind the decline in stocks holding above their long-term averages. Mega-cap tech stocks continue propping up index performance while many mid-caps and cyclicals fall behind. Volatile Treasury yields are putting pressure on rate-sensitive sectors. Earnings season delivered mixed results across consumer, industrial, and healthcare names, weakening individual stock trends. And macro uncertainty is pushing investors toward a more defensive stance.
Even as headline indexes look stable, fewer stocks are maintaining their long-term moving averages – a classic sign of fragility under the surface.
The 50% Zone: A Historical Dividing Line
The 50% level has historically acted as a key marker. Above 50%, markets tend to be more stable and broad-based. Below 50% often signals risk of broader pullbacks as long-term uptrends crack across sectors. With breadth now just above this threshold, we're approaching a level that frequently determines whether consolidation turns into correction.
What to Watch Next
The next moves in breadth will depend on several factors: whether mega-cap leadership keeps supporting the overall index, if cyclicals and mid-caps can stabilize, how markets react to upcoming inflation and employment data, and whether breadth rebounds toward the mid-50s where previous recoveries started.
A rebound would suggest improving participation. Continued weakness may signal the market's foundation is cracking further.
A Cautionary Signal Worth Watching
With just 51% of S&P 500 stocks above their 200-day average, internal strength is clearly fading. This gap between index performance and underlying participation deserves attention.
If breadth stabilizes and recovers, the S&P 500 could hold its ground. But if the indicator drops decisively below 50%, a broader reset across equities might not be far off.
 Alex Dudov

 Alex Dudov


