 Marina Lyubimova

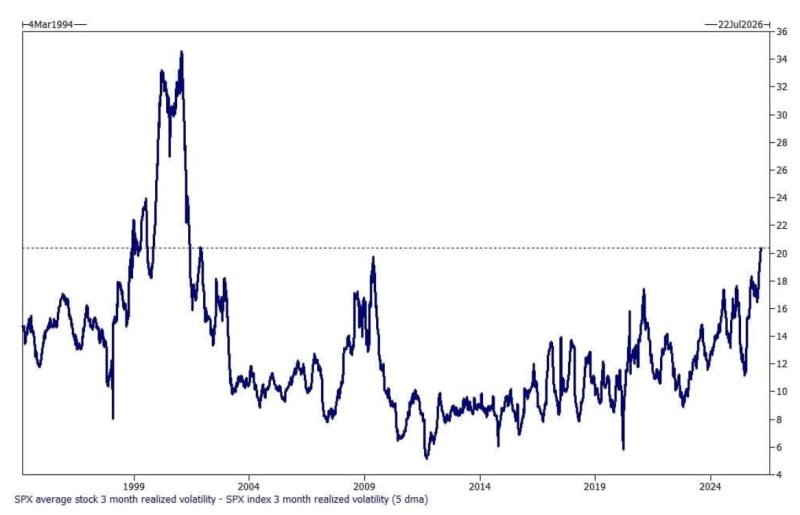
⬤ A rare divergence is unfolding inside the S&P 500 volatility spread. As Barchart noted, the average SPX component stock is now more volatile than the index by the widest margin in roughly 25 years. The three-month realized volatility spread between individual stocks and the broader index has surged to around 20, a threshold last approached during the late 1990s tech bubble.
When the average S&P 500 stock becomes far more volatile than the SPX index, it signals that dispersion within the market is sharply increasing.
⬤ Historical context stretching back to March 1994 shows the spread compressing through the early 2000s and the post-financial-crisis recovery period, before expanding sharply again in recent years. The most dramatic prior spike came during the dot-com era, when individual tech stocks surged wildly while the headline index moved more calmly. The S&P 500's narrowest January-February range since 1928 offered an earlier glimpse of this dynamic, where the index held tight even as individual names swung dramatically beneath the surface.
⬤ The gap reflects how index-level aggregation naturally dampens volatility: gains in some stocks offset losses in others, leaving the SPX seemingly calm. But when individual stock swings are this large relative to the index, it points to growing internal dispersion. That same theme appeared in high-beta momentum hitting 24% outperformance, one of the largest performance gaps between stock groups in two decades.
⬤ The widening spread is a structural signal worth watching. As stock-level volatility rises well above index volatility, headline SPX stability increasingly masks intense churning beneath. For investors focused only on the index, this gap is a reminder that the surface calm can conceal a far more turbulent reality playing out across individual U.S. large-cap equities.
 Marina Lyubimova


