 Usman Salis
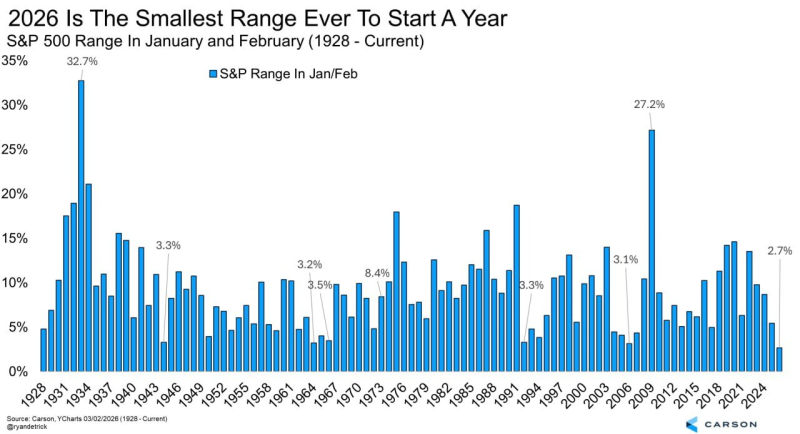
If you were watching the S&P 500 in early 2026, you might have thought the market was asleep. The index drifted through January and February within a range of just 2.7% - a figure that turns out to be the smallest opening stretch for any calendar year going back nearly a century. The last time markets started a year this quietly was before the Great Depression. And yet, underneath that calm surface, plenty was happening.
98 Years of Data Show How Rare a 2.7% Range Really Is
Historical data spanning 1928 through early March 2026 puts the number in stark perspective. Most January-February periods see the S&P 500 move more than 5%, and in volatile years - think the 2008 financial crisis or the COVID shock - early-year ranges blew past 15% or even 20%. The 2026 range sits so far below historical norms that it barely registers on a standard chart. For context, S&P 500 and Nasdaq have been outperforming Bitcoin despite posting lower volatility - a dynamic that has puzzled traders who expected more directional movement as the year opened.
Index Calm Hides Elevated Volatility Across 500 Components
What makes the 2026 setup particularly interesting is the disconnect between the index and its components. Large-cap names have been going in very different directions - some surging, others pulling back - while the aggregate barely registers movement. This points to a market driven by stock-specific narratives and sector rotations rather than broad macro sentiment. In fact, some observers have noted that the S&P 500 has started behaving more like a memecoin with extreme intraday price swings at the individual security level, even when the headline number stays flat.
Adding another layer, hedge funds have ramped up short positions to levels last seen in 2020 while the S&P 500 holds flat - a signal that institutional players are not buying the calm at face value. That combination of compressed index volatility and elevated positioning risk creates a setup where the eventual directional break, when it comes, could be swift.
For now, the 2.7% range reflects balanced forces between buyers and sellers across all 500 components. Whether that balance tips toward a breakout or a breakdown will be one of the defining market questions as 2026 unfolds.
 Usman Salis


