 Marina Lyubimova

⬤ The volatility landscape in U.S. equities is flashing an unusual signal. According to Barchart, the spread between single-stock implied volatility and S&P 500 implied volatility has hit its highest level since October 2008. The long-term chart tracking 9-month at-the-money implied volatility differences — from March 2006 through July 17, 2026 — shows the latest reading circled near 18, placing it firmly at the upper end of the historical range.
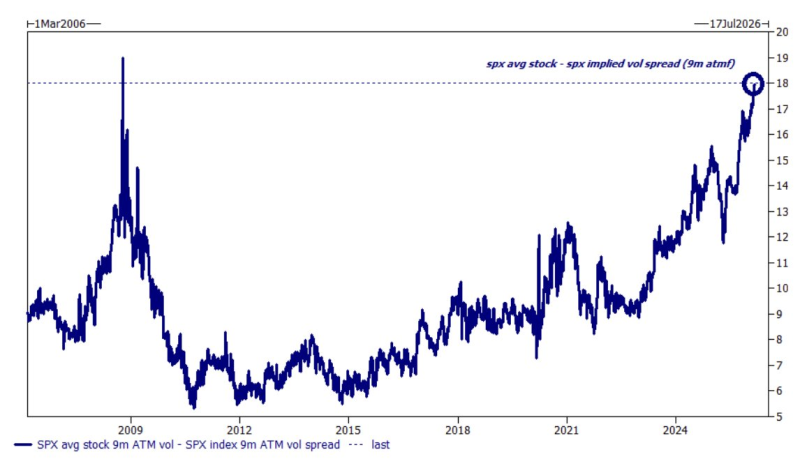
⬤ After the 2008 crisis, the spread narrowed sharply and stayed relatively quiet through most of the 2010s, with short-lived spikes around major market events. More recent years showed a gradual climb, with noticeable expansions around 2020 and 2022 — but neither came close to today's reading. The current gap underscores just how differently traders are pricing individual stock risk versus broad index risk right now.
⬤ Historically, a widening spread like this reflects rising dispersion expectations — conditions that often show up during periods of uneven sector performance or heightened uncertainty. Recent coverage on S&P 500 Bearish Breadth Regime has highlighted related structural shifts, noting that multiple technical indicators are pointing lower relative to short-term averages. Meanwhile, data on S&P 500 Momentum Spread hitting 23.7 mirrors the same divergence theme playing out in volatility measures.
⬤ The practical implications are real. A spread this wide tends to shift how traders approach hedging, sector rotation, and risk premium pricing. It also adds a layer of complexity when interpreting overall market stability — especially as broader dynamics, such as those explored in the analysis of S&P 500 and NASDAQ outperforming Bitcoin despite lower volatility, continue to reshape the cross-asset volatility picture heading into the second half of 2026.
 Marina Lyubimova


