 Usman Salis

⬤ High beta momentum has blown past the S&P 500 by roughly24%since the start of the year — one of the widest spreads we've seen in the last two decades. The chart tracking the gap between high beta momentum returns and SPX 20-day performance shows a sharp spike upward, landing among the most extreme readings since the early 2000s.
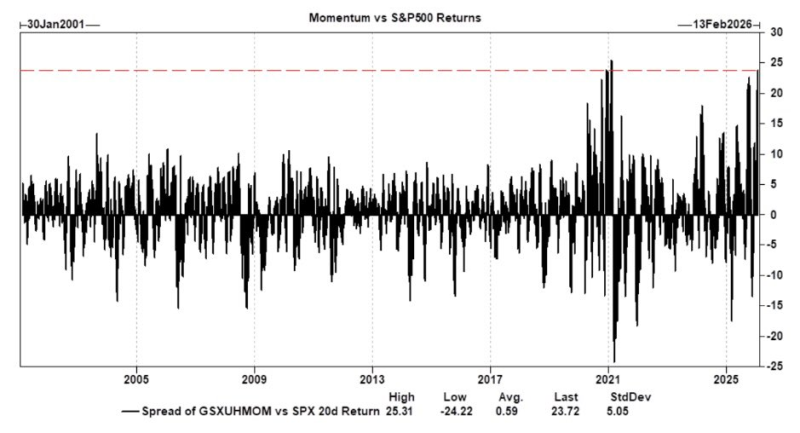
⬤ Current Spread23.7Historical Avg0.6Recorded Max25+Std Deviation~5Looking at data going back to 2001, the current spread is wildly out of line with history. The latest reading sits near23.7, while the long-term average is just0.6. Only a handful of periods over the past 20+ years have come anywhere close to today's levels."
⬤ Historically, spikes like this one have shown up during periods of high market stress — the dot-com bust, the 2008 financial crisis, and the post-COVID rally. Each time, that kind of extreme relative strength came with aggressive risk-taking and rapid price moves, not steady, sustainable gains.
⬤ Why does this matter? When high beta momentum diverges this sharply from the S&P 500, it's a sign the market is driven more by short-term bets than by broader conviction. These phases can last a while, but history shows they tend to end with increased volatility once momentum starts fading.
 Usman Salis


