 Sergey Diakov

The NASDAQ's sharp upward move has stalled just below the 25,000 level, shifting into a tight consolidation phase that reflects cooling momentum rather than structural weakness. According to analysis shared by Forex Sinyal Merkezi, the index pulled back from the 25,000 zone and is now compressing in a narrow range, suggesting the market is stabilizing after a strong advance.
This shift does not indicate a breakdown. The broader trend remains upward, with price still holding above key support zones formed during the breakout phase. The rejection near 25,000 stands out as the first meaningful resistance, but selling pressure remains limited, keeping the structure intact.
NASDAQ Consolidates Between 24,750 and 24,900
The move follows a clear impulsive rally, with price transitioning into a sideways-to-slightly downward structure. A tight consolidation range between 24,750 and 24,900 has formed, and the price action within it points to a market that is resting rather than reversing.
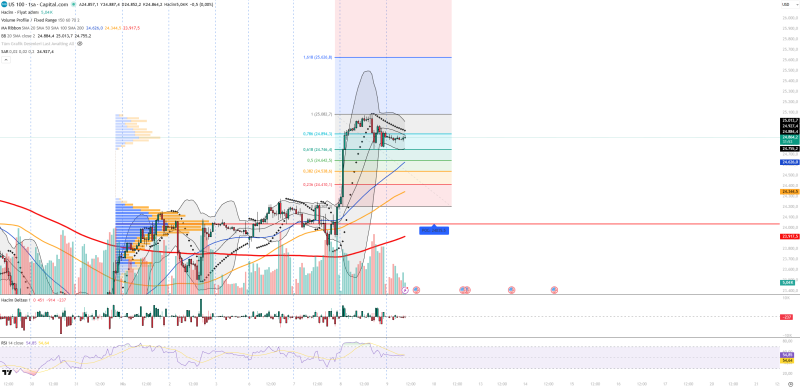
RSI sitting around 54 reflects balanced momentum - the market is pausing after an extended move, not reversing direction
NASDAQ Breakout: US100 Surges Past 25,000 - the prior breakout run set the stage for this current consolidation, making context from that move essential for reading where price goes next.
Technical Indicators Signal Pause, Not Reversal
Technical signals align with a neutral consolidation phase:
- RSI is around 54, reflecting balanced momentum
- Volume is weaker during the pullback, indicating a healthy correction rather than aggressive selling
- Bollinger Bands are narrowing, signaling a volatility squeeze
- Parabolic SAR has flipped bearish in the short term
- Buyer-seller delta remains neutral
Volume drying up during the pullback is exactly what you want to see in a healthy correction - it tells you sellers aren't in control
This combination suggests the market is pausing after an extended move rather than shifting into a new downtrend. The narrowing Bollinger Bands are particularly notable - compression at this level often precedes a sharp directional move.
NASDAQ Holds Near 24,000 as Tight Consolidation Continues - a similar consolidation pattern played out near 24,000 before the most recent leg higher, offering a useful structural comparison.
NASDAQ Support at 24,035 Marks the Key Trend Anchor
Support levels are layered beneath the current range, with 24,750 acting as the immediate floor. Below that, 24,620 and 24,340 mark deeper retracement zones.
The most important structural level sits at 24,035 - identified as the volume profile point of control. This area represents the main support zone where the broader trend would likely be defended if selling pressure intensifies.
On the upside, resistance remains clustered at 24,900 and above, with further levels extending toward 25,080, 25,260, and 25,600.
The 24,035 level is where the bulk of trading activity has been anchored - losing that would change the picture entirely
NASDAQ Breaks Down After 24,200 Rejection - previous breakdowns from similar resistance zones provide context for how quickly structure can shift if key support gives way.
Compression Builds Pressure for the Next Expansion Move
The defining feature of the current NASDAQ setup is compression. The narrowing range and reduced volatility suggest that a larger directional move is building, with the breakout direction likely determined by whether bulls can reclaim 25,000 or sellers push price below 24,750.
For now, the market remains in a holding pattern just below resistance, maintaining its bullish structure while waiting for the next expansion phase. This type of consolidation near highs often reflects continuation behavior - price stabilizes, momentum resets, and the next leg higher begins when the squeeze resolves.
 Sergey Diakov


