 Eseandre Mordi

The NASDAQ (US100) has delivered a decisive breakout, rapidly advancing from the 24,800 region into 25,000+ territory. The move reflects a clear shift into bullish momentum, with price accelerating above prior structure and establishing a strong upward trend. As Forex Sinyal Merkezi noted, the market is now firmly in an uptrend with strong momentum conditions - though the transition from consolidation into expansion rarely comes without short-term pauses.
US100 Breakout Structure Leaves 24,035 as the Key Base
The chart shows a strong upward move originating from the 24,800 area, where price quickly expanded into higher levels without prolonged hesitation. The structure is clearly trending higher, with price holding above prior consolidation zones.
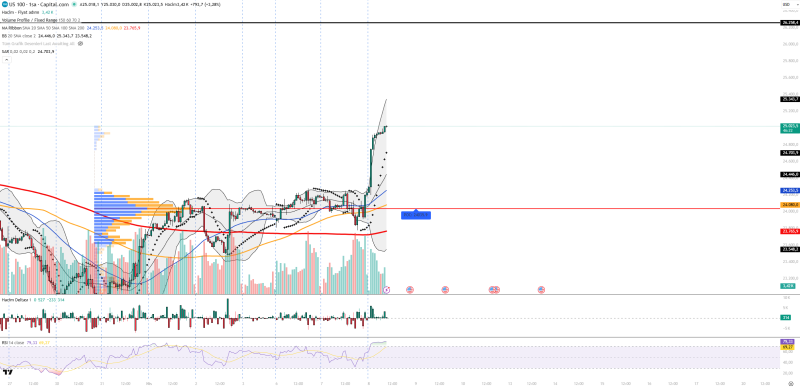
A critical technical reference sits near the 24,035 area - identified as the volume profile point of control and the base of the entire breakout.
The market is now in full momentum mode, with the breakout from 24,800 setting up a new structural range above 25,000.
Holding above this level reinforces the strength of the move and confirms that buyers have taken meaningful control of the structure.
Momentum Indicators Confirm the Trend but Signal Stretch
The technical backdrop aligns with a strong bullish phase, though it also points to increasingly stretched conditions:
- RSI is above 70, indicating overbought territory
- Volume is rising, confirming strong buying participation
- Bollinger Bands are expanding upward, signaling volatility expansion
- Parabolic SAR remains positioned below price, supporting the trend
- Buyer-seller delta remains positive
These signals collectively highlight a market in momentum mode, where NASDAQ tests 25,000 resistance after rebound becomes an increasingly relevant reference point. Trend continuation is favored - but the probability of a short-term pullback rises as conditions become extended.
NASDAQ Price Levels to Watch Above and Below 25,000
While the breakout is clear, the chart also outlines zones where price may react. Resistance levels are stacked above current price, with the first key area around 25,250-25,350, followed by higher zones near 25,800 and 26,250.
On the downside, the breakout structure leaves behind layered support levels - including 24,700, 24,450, 24,250, and the key base near 24,035. Traders following NASDAQ price analysis around the 25,000 resistance zone will recognize this area as a critical decision point for continuation or rejection.
Any pullback into these zones would likely be viewed within the context of an ongoing trend rather than an immediate reversal - as long as price holds above the breakout base.
The layered support structure below 25,000 gives the trend room to breathe, with 24,035 serving as the line in the sand for bulls.
This type of breakout behavior aligns with recent patterns, where NASDAQ 100 breaks resistance after extended consolidation phases tend to set up structured follow-through moves rather than immediate reversals.
 Eseandre Mordi


