 Saad Ullah

NASDAQ is entering a phase of controlled consolidation just above the 24,000 mark, where price action reflects balance rather than expansion. Following a strong rebound, the index has shifted into a horizontal-to-slightly-upward structure, maintaining its short-term trend while repeatedly testing resistance near the upper band. Forex Sinyal Merkezi notes that the index remains in this formation following its rebound, with indicators reflecting stability rather than expansion.
NASDAQ Range Between 23,900 and 24,150 Defines Price Behavior
The hourly structure shows NASDAQ compressing between roughly 23,900 and 24,150, forming a tight range after its recovery move. Rather than continuing impulsively higher, price is moving sideways with a slight upward tilt - reflecting a market that is holding gains but not accelerating.
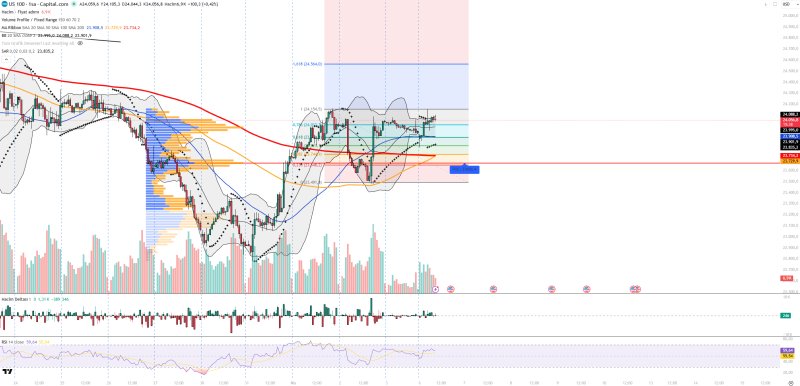
Bollinger Bands confirm this dynamic, with price positioned between the middle and upper bands, indicating controlled bullish pressure without breakout momentum. The lack of expansion suggests volatility is contracting as the market builds a base near resistance.
Consolidation near highs often signals continuation potential - but only if buyers can overcome the supply zone above.
This type of behavior is not unusual. NASDAQ Breaks Down After 24,200 Rejection showed a comparable situation where resistance zones played a defining role in price direction.
NASDAQ Support Holds Firm at 23,664 Point of Control
The most critical support comes from the Volume Profile Point of Control near 23,664, which continues to act as the main equilibrium level. Price holding above this zone reinforces the idea that buyers remain active and are defending dips.
Additional support levels at 23,908 and 23,734 have consistently absorbed pullbacks during the range formation, helping preserve the short-term bullish structure. The presence of higher lows within this band confirms that downside pressure remains limited for now.
Momentum indicators align with this structure:
- RSI sits near 59, reflecting positive but not overextended momentum
- Volume remains balanced, with no clear breakout activity
- Volume Delta is neutral, signaling equilibrium between buyers and sellers
- Parabolic SAR continues to support the upward trend
Sellers are active at the top of the range, but not strong enough to force a breakdown below support.
These signals collectively point to a stable market rather than one under stress. A similar dynamic played out in Nasdaq 100 Rebound Faces Pressure Below Resistance, where rebounds stalled under supply zones in a nearly identical setup.
Resistance at 24,088-24,154 Keeps Capping NASDAQ Upside
On the upside, the 24,088-24,154 zone is acting as immediate resistance, with price repeatedly failing to establish acceptance above it. Each test into this region has been met with selling, preventing continuation toward higher targets.
Beyond this range, the next resistance levels stand at 24,564 and 25,000, but they remain out of reach unless a clear breakout occurs. The structure here is important: price is not reversing - it is stalling. This distinction matters, because it suggests the bulls are still in control of the trend even if momentum is paused.
The longer price holds above the 23,664 support while compressing below 24,154 resistance, the more meaningful the eventual breakout becomes.
This balance is typical of a market preparing for its next move. NASDAQ Price Analysis: Index Consolidates Below 25,203 documented a strikingly similar pattern, where a tight range formed before the index chose its next direction.
For now, the structure remains constructive - but incomplete. The trend is intact, yet momentum is clearly pausing as the market tests the limits of buyer conviction.
 Saad Ullah


