 Marina Lyubimova

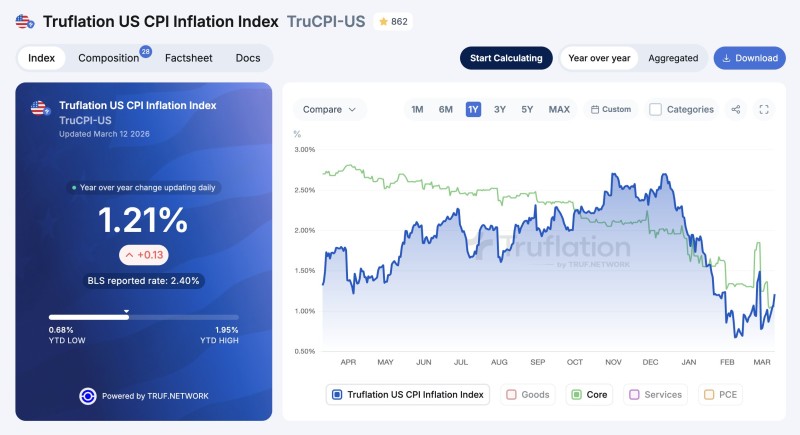
Real-time inflation data from Truflation shows US consumer prices accelerating again. The Truflation US CPI Inflation Index climbed to 1.21% year over year, up from 1.08%, with the move driven almost entirely by a sharp jump in gasoline costs. While the official BLS rate holds at 2.40%, Truflation's daily data tells a more volatile story.
Gasoline Adds 0.13 Percentage Points to CPI in One Move
Fuel prices were the single biggest driver behind the latest reading. National average gasoline prices rose 5.7% year over year, with the growth rate accelerating from roughly 6.64% to around 12.34%. Since gasoline carries a weight of about 3% in the headline CPI basket, that surge translated directly into a 0.13 percentage point increase in the overall index. The current reading sits within a yearly range of 0.68% (year-to-date low) to 1.95% (year-to-date high).
EIA Data Shows 15% Weekly Spike as Volatility Spreads Across Categories
The scale of the move stands out even in short-term data. The US Energy Information Administration recorded a spike of roughly 15% in gasoline prices over a single week, pointing to unusually sharp short-term volatility in fuel markets. Because Truflation updates daily using real-time price feeds from multiple providers, those swings transmitted into the index almost immediately.
Beyond energy, Truflation flagged growing price instability across multiple consumer categories. The platform links the trend to shifting geopolitical conditions and policy uncertainty, which are feeding through to underlying cost structures across the economy. For broader context on how real-time inflation tracking diverges from official statistics, see Truflation Shows US CPI at 0.92% While Official Reading Stays at 2.4%. Earlier data on the cooling trend is also covered in US CPI Inflation Drops to 0.86% as Utilities Lead Price Cooling.
 Marina Lyubimova


