 Saad Ullah

⬤ US inflation pressures cooled significantly in early February, with Truflation's real-time CPI data showing a drop from 1.24% to 0.86% year over year—the lowest reading since 2020. The decline touches multiple consumer categories, pointing to a genuine cooling trend rather than isolated price movements.
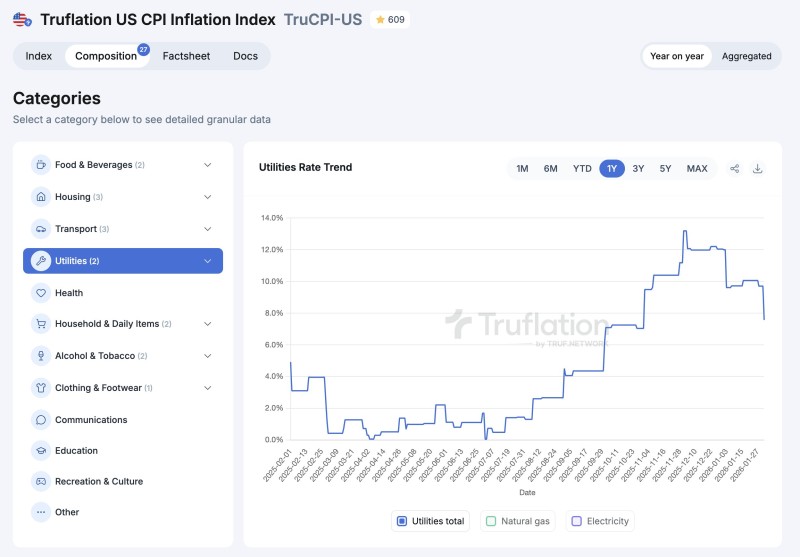
⬤ Utilities drove the biggest portion of the drop, falling 0.13% day over day. Clothing prices came next with a 0.08% decrease, while housing and transport each shed 0.05%. Food prices also contributed to the downward trend. The chart shows utilities have been easing steadily over the past year after hitting peak levels during the earlier winter months.
⬤ What's interesting here is the timing. Consumer utility bills actually cooled even though wholesale natural gas markets were going wild in January 2026. Winter Storm Fern, Arctic temperatures, production freeze-offs in Texas, and surging heating demand pushed Henry Hub prices to multi-year highs mid-month before they settled back down.
⬤ The reason for this disconnect is pretty straightforward: retail utility pricing works on a delay. Regulatory systems and quarterly rate adjustments mean that short-term wholesale price spikes don't immediately show up on household bills. So Truflation's high-frequency tracking caught the consumer-level cooling while wholesale energy markets were still dealing with temporary chaos.
⬤ For markets, this 0.86% reading matters because it suggests consumer-level inflation might be cooling faster than traditional government data can capture. If this trend holds, it could shift expectations around Fed policy, interest rates, and overall economic conditions—and it shows why real-time pricing data is becoming more important for understanding what's actually happening with inflation right now.
 Saad Ullah


