 Marina Lyubimova
⬤ XRP has pulled back to a critical price zone that has served as yearly support, with the token now trading around 1.87according torecent market analysis. The weekly chart shows several consecutive red candles as the price tests a support band that previously triggered bounces earlier this year. As one analyst noted, " Asoneanalystnoted,"XRP is potentially losing its yearly support," bringing fresh attention to this technically important level during a period of broader caution across crypto markets.
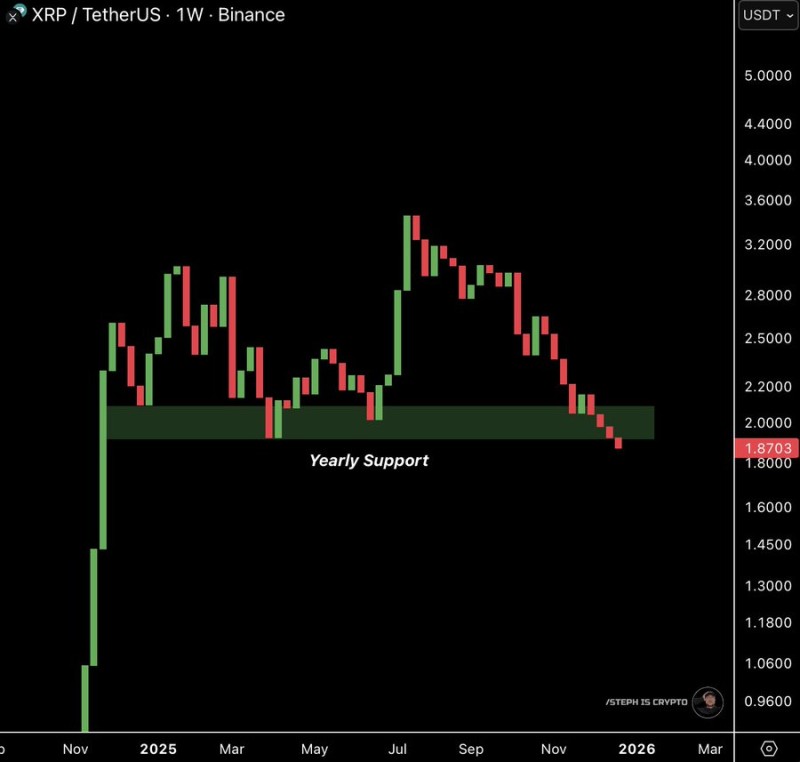
⬤ The chart reveals how XRP previously found buyers in this zone before rallying higher, but momentum has clearly shifted. The support region stretches roughly between $1.8 and just above $2.0, making it a meaningful area for traders tracking longer-term price structure. What happens here could set the tone for the next phase of price action—whether XRP stabilizes and rebuilds or breaks down further.
⬤ If the token manages to hold and recover from this range, it would suggest buying interest remains intact at these levels. But a sustained close below the support zone might signal a technical breakdown, potentially reshaping sentiment around the asset. These key levels often act as psychological markers in digital assets, influencing how traders position themselves.
⬤ The behavior around this $1.8-$2.0 support range could play a meaningful role in near-term market direction. With XRP remaining a closely watched cryptocurrency, how it reacts at this yearly support may help define broader confidence and expectations across the sector in the weeks ahead.
 Marina Lyubimova


