Sergey Diakov
XRP is under sustained pressure after recording six consecutive red monthly closes in 2026 - the longest losing streak in its history. As noted by Xaif Crypto, the asset has declined sharply from $3.65 to $1.32, with technical signals pointing to a firmly bearish structure that continues to weigh on price action.
The XRP Breakdown That Shifted Market Structure
The chart shows a clear transition from consolidation into a downtrend. After failing to sustain higher levels, XRP began forming a sequence of lower highs, eventually breaking below prior support zones.
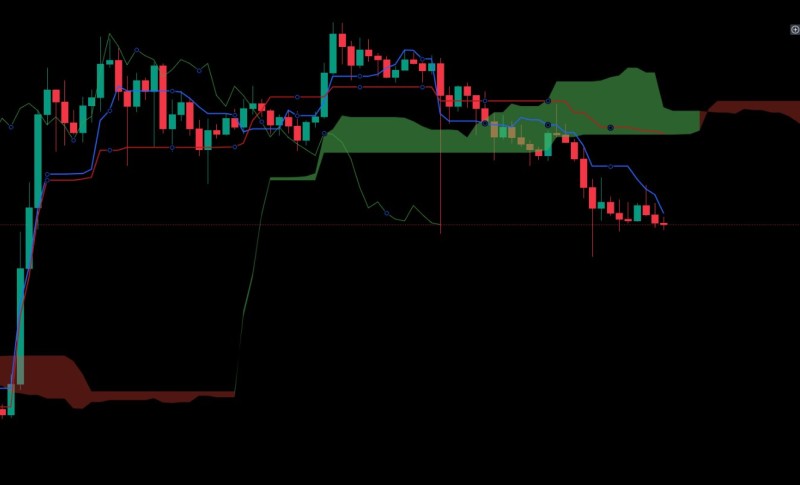
That shift marked a structural change. Former support areas no longer held, and each recovery attempt was capped below previous highs. The inability to reclaim these levels reinforced the bearish trend and confirmed that sellers had taken control of momentum.
The Ichimoku Cloud Remains Firmly Bearish on XRP
A key feature on the chart is the Ichimoku cloud, which has turned fully bearish. Price is trading below the cloud, while the projected cloud ahead remains negative, signaling continued downward pressure.
Attempts to move back into the cloud have been rejected, indicating that this zone is acting as resistance rather than support. This aligns with broader technical conditions where downward continuation remains the dominant pattern.
Six consecutive red monthly closes in 2026 mark the longest losing streak in XRP's history, with each recovery attempt capped below previous highs.
Recent analysis has also pointed to downside continuation after key levels break, with projections suggesting further weakness once support zones fail.
Where XRP Selling Pressure Persists
Recent price action highlights continued weakness rather than reversal:
- Lower highs continue to define the structure
- Price remains below resistance zones formed during the decline
- Small-bodied candles near the lows reflect weak buying interest
The latest consolidation near $1.32 suggests temporary stabilization, but not a confirmed bottom. The trend remains intact as long as price fails to break above recent lower highs.
XRP Structure Still Points Lower in 2026
The chart offers no confirmed signs of accumulation. Instead, XRP continues to trade within a controlled downtrend, with pressure building below resistance.
At the same time, longer-term patterns still suggest that extended compression phases can precede large moves, particularly when volatility tightens over time. Longer-term projections point to significant upside potential once structure shifts - but that remains a future scenario.
The chart offers no confirmed signs of accumulation. XRP continues to trade within a controlled downtrend, with pressure building below key resistance levels.
For now, XRP remains locked in bearish structure, with price action continuing to reflect a market that has yet to find a firm floor. XRP fractal patterns suggest a potential triangle breakout risk remains on the horizon, though timing remains uncertain.
 Sergey Diakov