 Victoria Bazir
Crypto analyst ChartNerd is drawing attention to a long-term XRP structure that mirrors the 2013-2017 cycle, where a symmetrical triangle resolved into an explosive breakout and retest sequence before a sharp expansion phase.
XRP Triangle Structure Repeats Across 2013-2026 Cycles
The chart directly compares two periods: 2013-2017 and 2018-2026. In both cases, XRP forms a symmetrical triangle defined by descending resistance and ascending support.
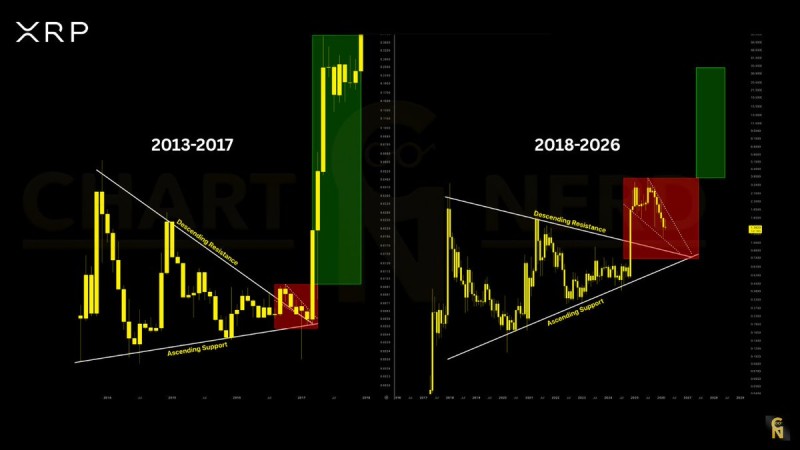
In the earlier cycle, price tightened into the apex before breaking out, followed by a retest of the breakout level - a sequence that preceded the sharp expansion phase into 2017. The current structure reflects the same compression behavior, with trendlines converging and volatility narrowing as XRP approaches a decision point.
The current setup mirrors the 2013-2017 cycle, where a symmetrical triangle resolved into an explosive move after a breakout and retest.
This aligns with broader technical observations where XRP has repeatedly traded inside tightening triangle formations ahead of large directional moves, as noted in XRP Price Analysis: Symmetrical Triangle Breakout Approaching - compression near the apex typically precedes expansion.
Where the XRP Breakout Setup Remains Incomplete
Unlike the 2017 breakout phase, the current chart shows XRP still interacting with descending resistance. The highlighted red zone reflects rejection, not confirmation. There is no confirmed breakout yet - the structure is still in compression:
- Price continues to respect descending resistance
- Higher lows are forming against ascending support
- The range is tightening toward the apex
Price remains inside the triangle, approaching a decision point where compression can no longer sustain itself.
This behavior reflects a buildup phase rather than a completed move. Similar conditions have been observed in recent XRP setups, as covered in XRP Price Analysis: Triangle Squeeze Points to Monday Volatility, where narrowing price action signals an impending move.
XRP Breakout-Retest Dynamic Mirrors 2017 Fractal
The key detail in the fractal comparison is not just the breakout itself, but the retest that followed. In 2017, XRP broke above resistance, then returned to confirm it as support before accelerating higher. That exact sequence is what the current setup is suggesting - but not yet confirming.
Triangle structures like this often lead to strong directional moves once resolved, especially after prolonged compression.
Triangle structures like this tend to produce strong directional moves once resolved, particularly after extended compression periods. This dynamic is reflected in XRP Crypto News: Breakout Retest Signals Bullish Continuation, where a confirmed breakout followed by a successful retest triggered further upside momentum.
For now, XRP remains inside the structure. The fractal highlights a potential path, not a completed signal. The market is approaching a point where compression can no longer sustain itself - and when that happens, the resolution tends to be decisive.
 Victoria Bazir


