 Peter Smith

ETF flow data is flashing a clear rotation signal across US equity markets. A momentum chart covering the top 200 ETFs by assets under management shows Treasury and Broad Equity sectors pulling in the largest inflows relative to their historical averages. Tracking these flows reveals where institutional capital is quietly repositioning before the broader market catches on.
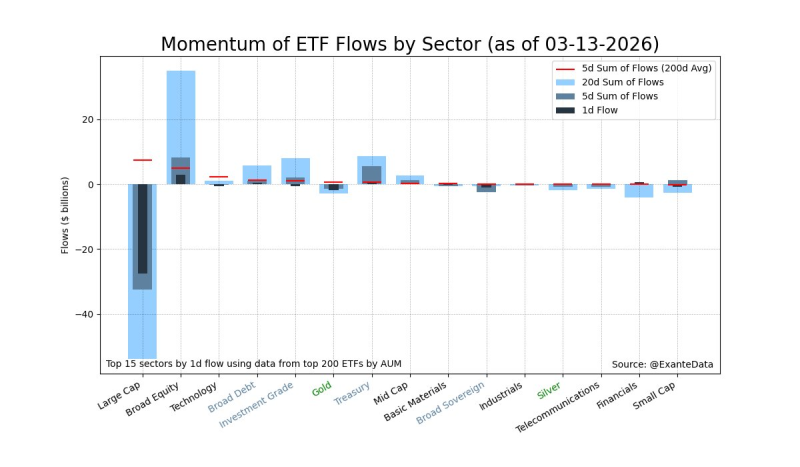
Treasury ETFs are showing some of the strongest positive momentum vs. long-term averages in the current dataset. Broad Equity ETFs are also seeing notable demand, pointing to appetite for diversified market exposure. This mirrors the pattern covered in ETF Flows Shift Toward Large Cap as Defensive Rotation Builds, where cross-category capital movement flagged evolving macro positioning early.
Monitoring ETF flows helps reveal where institutional capital is positioning within US equities and related asset classes.
On the other side of the ledger, Large Cap ETFs are recording some of the sharpest outflows in the latest data. Broad Sovereign bond ETFs are also in negative territory relative to historical norms. This kind of sector divergence is a closely watched signal for shifting sentiment and tactical reallocation. A similar dynamic played out in the crypto space, as explored in Bitcoin or Altcoins? How to Build Your Digital Asset Portfolio in 2025.
The gap between inflows into Treasury and Broad Equity ETFs and outflows from Large Cap and Broad Sovereign funds shows how fast portfolio positioning can shift when macro expectations change. ETF flow analysis has become one of the clearest tools for reading sector rotation and liquidity dynamics in real time. For context on how defensive positioning is playing out across sectors, see XLP Consumer Staples Jump 17% in 5 Weeks as Defensive Buying Surges.
 Peter Smith


