Peter Smith

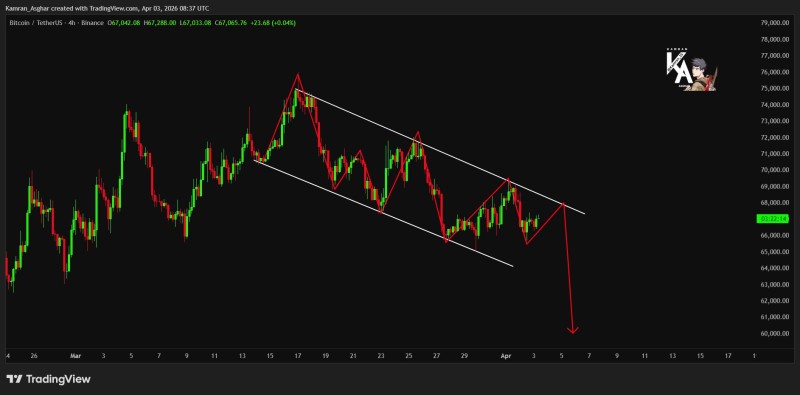
Bitcoin is showing persistent weakness, with price action locked inside a descending channel that keeps handing control to sellers. There's no credible breakout attempt in sight - and that alone says a lot about where momentum currently sits. Kamran Asghar flagged the setup, pointing out that BTC is moving within a classic descending pattern defined by consistent lower highs and controlled downward drift.
Each time price pushes toward the upper boundary, it gets turned away. Rallies are being sold into, not sustained - and that repeated behavior is keeping bearish momentum firmly in charge.
A Structure Built on Lower Highs and Fading Rallies
The chart tells a straightforward story. Multiple rejection points have formed along the descending resistance line, and none of them have come close to flipping the structure.
Every bounce runs out of steam before it can challenge the trendline from above.
The chart clearly shows a descending channel with multiple rejection points forming along the upper boundary - each rally attempt fades before it can threaten resistance.
This kind of price action isn't random. It reflects a market where buyers are unable to build on any upside momentum and where sellers are consistently stepping in at lower and lower levels. The pattern is well-defined and, so far, showing no signs of breaking down on the bullish side.
BTC Compresses Near the Lower Boundary - 3 Warning Signs
Price has drifted closer to the lower edge of the channel, where bounces have happened before. But those reactions are looking less convincing now, which points to weakening demand even at what should be a supportive area.
This kind of compression - price squeezing between descending resistance above and a flattening support zone below - tends to resolve with a sharp directional move. Given the overall structure, the lean is clearly bearish. As Kamran Asghar noted:
Price is now hovering near the lower boundary of the channel, but the bounces from this area appear less decisive - suggesting that demand at support is beginning to fade.
The current setup has three key characteristics worth watching:
- Clear descending channel formation with defined boundaries
- Repeated rejection at the upper trendline, no breakout attempts
- Price drifting toward the lower boundary with weakening bounce reactions
A similar dynamic played out in BTC Rejected at $76K as Bearish Structure Points to Sub-$50K, where persistent rejection inside a weakening structure led to downside continuation.
Breakdown Scenario: Why the Chart Points Lower
The projected path visible on the chart favors a breakdown. Lower highs are still forming, resistance is holding, and the structure leaves little room for bullish expansion unless the channel gets convincingly invalidated.
Unless price breaks above the channel and reclaims higher ground, the dominant signal stays the same - a controlled downtrend with rising probability of a breakdown toward lower zones.
This isn't a new story for Bitcoin. BTC Forms Third Leg Down in Repeating Crash Structure covered a comparable setup where similar formations developed into extended declines - and the parallels to the current chart are hard to ignore.
BTC Still Under Pressure With No Reversal Signal in Sight
Nothing in Bitcoin's current structure suggests a reversal is forming. There are no higher highs, no reclaim of descending resistance, and no shift in the pattern that would give bulls a reason to step in with confidence.
The dominant signal remains intact - a downtrend in control, with breakdown risk growing the longer price stays compressed inside the channel. That broader picture is consistent with what was laid out in BTC Breaks Bullish Structure as $65K Support Faces Critical Test, where loss of structure reinforced continued bearish follow-through.
Until BTC breaks above the channel and sustains that move, the path of least resistance points lower.
 Peter Smith