 Marina Lyubimova

Bitcoin's latest rally attempt just hit a wall — and not for the first time. After pushing into the $74,000–$76,000 range, price got rejected from a defined bearish order block, reinforcing a broader downtrend that doesn't show many signs of reversing. According to Crypto Patel, this move isn't a breakout attempt — it's a lower high within a continuing bearish market cycle.
The Rejection That Confirms the Setup
The chart structure lines up closely with what Crypto Patel flagged. Price rallied into a marked supply zone (Bearish OB 1) and was immediately turned away — confirming that sellers are still active at that level. The rejection hit a clearly defined order block, followed a sequence of lower highs, and failed to break prior structural resistance.
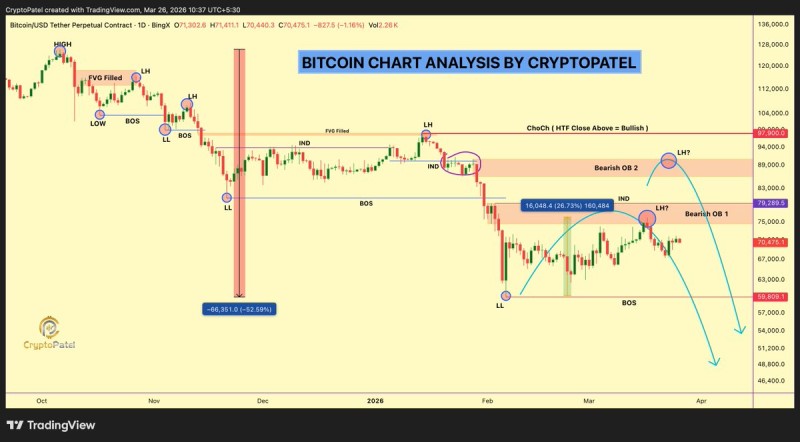
The chart explicitly labels this area as a potential "LH?" (lower high), reinforcing the idea that this isn't strength — it's continuation. For traders watching similar setups, Bitcoin Faces $80K Breakout or Drop Below $50K at Critical Decision Zones outlines what those downside scenarios could look like.
A Structure Built on Lower Highs and Breakdowns
Zoom out and the picture gets cleaner — and more concerning. The broader chart shows a major breakdown (BOS) earlier in the trend, a sharp decline forming a new lower low, weak recovery attempts that fail at supply, and continued formation of lower highs. This is textbook bearish market structure. Each rally into resistance is being sold, not accumulated. The chart also highlights internal distribution zones ("IND") and multiple failed attempts to reclaim higher levels — price isn't building strength, it's rotating within a bearish framework.
That kind of failed recovery is consistent with what was described in Bitcoin Pulls Back to $66.5K After Failing to Hold $70K — What's Next for BTC?
The Resistance Stack Above Price
Even if Bitcoin manages to reclaim $76,000, the chart shows another major bearish order block sitting between $86,000 and $90,000 — which lines up with Crypto Patel's warning about "one trap after another." First rejection zone sits at ~$74K–$76K (already respected), second major supply at ~$86K–$90K, with a higher timeframe shift only possible above ~$97K (ChoCh level on chart). Upside isn't clean. Any rally would likely face multiple reaction points before any true structural reversal takes shape. The same pattern played out in Bitcoin Breaks Structure, $66K Support Now in Focus, where failed recoveries kept feeding the bearish trend.
The Downside Path That Remains Open
The most important takeaway from both the chart and Crypto Patel's analysis is that the downside structure is still intact. The next major area of interest sits below $50,000 — and that's not an arbitrary number. It aligns with prior consolidation zones and liquidity pools that the market hasn't revisited yet.
As long as Bitcoin keeps printing lower highs and failing at resistance, rallies are more likely to be distribution opportunities than signs of reversal. The rejection at $76,000 confirms that sellers haven't stepped away — and until they do, the broader structure continues to favor the downside.
 Marina Lyubimova


