 Saad Ullah

Bitcoin is entering what traders describe as the final phase of a multi-leg decline. According to Tryrex, a market commentator tracking BTC structure closely, the current setup aligns with a repeating crash pattern - one where the third leg tends to be the most decisive.
Bitcoin's recent price action is no longer just a pullback. It's evolving into a structured downtrend defined by consecutive lower highs and lower lows, and the chart suggests another leg down could now be underway.
The $100K Breakdown Pattern Repeating Across 3 BTC Legs
What stands out in the chart is the consistency of the structure. Bitcoin forms rising, weak consolidation channels before breaking down sharply. Each breakdown is impulsive and comparable in size to the previous one.
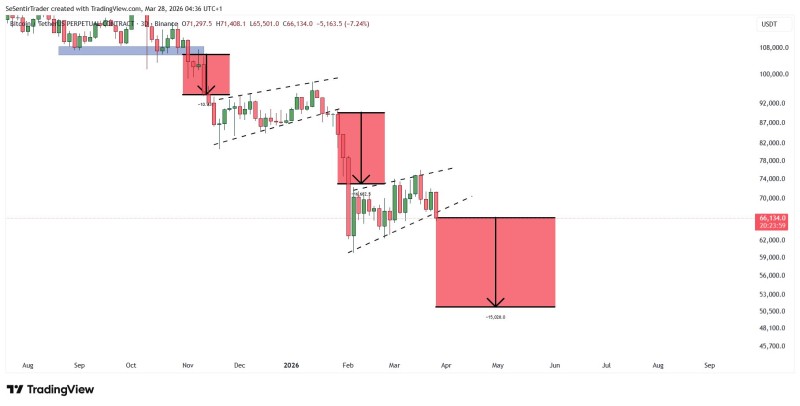
The first decline originated from a distribution range near the $100K+ region. That move led into a controlled consolidation before another breakdown followed, pushing price toward the low-$70K zone.
Price compressed within a narrow ascending channel before breaking lower - with momentum accelerating faster than in prior legs.
The current structure mirrors those earlier phases. Price compressed within a narrow ascending channel before breaking lower again - this time with momentum accelerating faster than in prior legs. Bitcoin price to USDT teeters on the brink as this sequence plays out.
$70K-$74K Bitcoin Support Flips to Overhead Resistance
One of the most important technical developments is the loss of the $70,000-$74,000 area. This zone previously acted as support during consolidation but has now clearly flipped into resistance.
Recent candles show rejection near that region, confirming that sellers are defending it. Instead of reclaiming prior highs, Bitcoin continues to print lower highs - an unmistakable sign of weakening structure.
The consolidation preceding the latest drop is also notably tighter than earlier ones. This type of compression often leads to stronger continuation moves, which is exactly what followed as price broke down aggressively. Analysts have been flagging this shift in a broader context - see also the Bitcoin breaks structure, $66K support now in focus analysis.
Chart Structure Points to $50K-$52K as the Next BTC Target
The projected downside move toward $50K is based on symmetry between prior legs. Each sell-off on the chart has produced a comparable vertical range, and the current projection follows that same logic.
From a technical standpoint, several elements reinforce the bearish trend:
- Persistent lower highs and lower lows
- Failed reclaim of broken support zones
- Increasing speed and size of downside candles
This kind of price behavior reflects a market transitioning from correction into a sustained downtrend - what many traders would define as early-stage bear market conditions.
Bitcoin is not moving randomly - it is following a structured sequence of breakdowns that has remained consistent across multiple phases.
Bitcoin is currently hovering near the mid-$60,000 range. The key question is whether this area can hold as temporary support. If price continues to drift lower and fails to establish a higher low, the probability of a full extension toward $50,000 increases significantly. Bitcoin price prediction rally warning flags related risks for bulls counting on a reversal.
So far, there are no signs of reversal - no breakout above resistance, no shift in structure, and no sustained buying pressure. For traders focused on technical analysis, the message from the chart is clear.
 Saad Ullah


