 Saad Ullah

Bitcoin is showing clear signs of structural weakness after losing key support and slipping below its rising channel. According to JDK Analysis, BTC has printed a lower low and is now trading beneath the channel's lower trendline, confirming a breakdown in bullish structure and raising downside risk across timeframes.
The chart confirms a decisive shift in momentum. Bitcoin previously traded within a rising channel, forming higher lows that sustained the uptrend. That structure has now been invalidated, with price breaking below the lower trendline and removing one of the key pillars of bullish continuation.
Price is failing to maintain prior structure - sellers stepped in at the $74K-$75K zone and pushed price lower, and that rejection tells you everything about where momentum stands right now.
Bitcoin Prints Lower Low Near $65K, Signaling Trend Reversal
The key signal is the formation of a lower low near the $65,000 region - a transition away from bullish continuation and a direct reflection of weakening momentum. The rejection near the $74,000-$75,000 zone reinforces this shift, as sellers stepped in at prior highs and drove price lower with conviction.
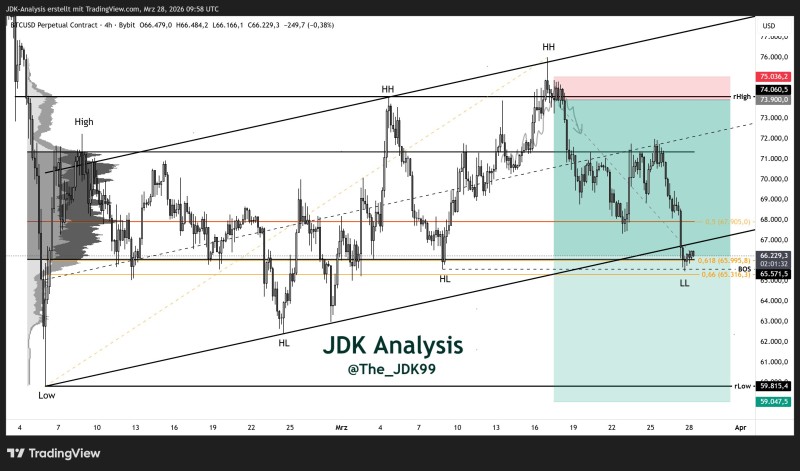
Bitcoin is currently holding around a confluence area near $65,500-$66,000. The chart highlights this as a key support region where value and structural levels intersect, though price action suggests it is being tested rather than strongly defended. Bitcoin eyes $69K as $68.4K support defines next move - a setup that mirrors the current structure, where BTC trades near key pivots that define the next directional move.
The $65K-$68K zone is the critical decision point right now. How price reacts here will determine whether we see continuation lower or a structural recovery attempt.
BTC Structure Now Favors Further Weakness
The transition from higher lows to a confirmed lower low signals a broader structural change. Bitcoin is no longer maintaining its prior trend and is instead entering a corrective phase with momentum tilted to the downside.
Bearish positioning has increased even as price stabilizes, with derivatives markets showing traders leaning toward downside continuation. BTC holds $60K support as resistance near $78K caps upside - a broader pattern that continues to define the range Bitcoin is navigating. The broken channel support now acts as resistance, reinforcing selling pressure unless price can reclaim it with sustained volume.
Until bulls reclaim the broken channel, that trendline flips to resistance - that's the structural reality the market is dealing with right now.
$59K-$60K Becomes the Next Target If Support Fails
The immediate focus is on whether BTC can hold the current support zone. If the confluence area around $65,000-$66,000 fails to contain selling pressure, the chart points toward the next downside region near $59,000-$60,000 - a level that aligns with broader technical expectations, where losing key support typically exposes lower liquidity zones.
Reclaiming higher levels would be required to shift structure back toward bullish continuation. Bitcoin range builds below $71K-$72K resistance zone - and that overhead ceiling remains firmly in place until bulls can produce a meaningful structural recovery. Until then, the technical setup remains tilted to the downside, and traders are watching every test of current support closely.
 Saad Ullah


