 Usman Salis

Bitcoin is trading in a compressed range beneath a key liquidity level, with price action signaling indecision while positioning builds around the $71.3K zone. Crypto analyst Hardy describes the current environment as "chop" - a sideways grind where the next directional move will likely be driven by liquidity mechanics rather than clear trend momentum.
Bitcoin's Sideways Structure Designed to Trap Traders
The chart shows BTC moving within a defined consolidation channel following a sharp decline.
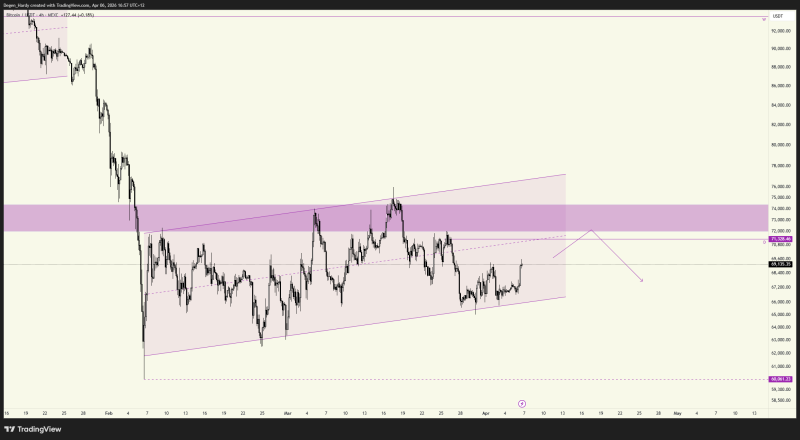
Price is oscillating between rising support and capped resistance, forming a tightening range rather than a clear trend. This behavior creates conditions where both long and short positions can be trapped simultaneously.
This type of environment often appears when liquidity is thin, allowing price to move unpredictably within a range before targeting key levels.
This setup isn't random. Consolidation phases like this tend to precede sharp, liquidity-driven moves - the kind that shake out traders positioned on the wrong side before the real direction reveals itself. For now, Bitcoin consolidates after POC sweep toward the $71,100 target, suggesting the market is still in the preparation phase.
The $71.3K Level Acting as a Liquidity Magnet
A central feature of this setup is the untapped level around $71.3K, sitting just above current price. This level remains clearly defined on the chart and unvisited - making it a natural target for a sweep.
In similar BTC setups, upside liquidity zones tend to attract price before any meaningful reaction occurs.
The repeated approach toward this level without a breakout is telling. Markets rarely leave obvious liquidity untouched indefinitely. The gradual buildup of pressure beneath $71.3K suggests price may still be working toward a final push higher to clear that liquidity before shifting direction.
The Pattern Behind BTC's Expected Move
The structure reflects a sequence commonly observed in technical analysis: sideways movement, followed by a liquidity grab, then a directional move. Current chart behavior includes:
- Tight consolidation beneath resistance
- No sustained breakout attempts
- Gradual positioning within the range
This pattern aligns with how Bitcoin drops below $74K in a classic liquidity sweep - where price first hunts liquidity above or below a range before reversing course. Traders watching for a clean breakout may be the ones getting caught.
After the $71.3K Sweep, Focus Shifts Lower
The projected path on the chart suggests a move above $71K may not lead to continuation. Instead, it could act as a setup for a reversal lower. This type of behavior - liquidity sweep followed by a shift in direction - is widely observed across crypto markets, where price frequently targets clustered orders before changing course. Bitcoin tests the $83K-$85K liquidity zone after Monday's flush offers a recent example of how these sweeps play out across different price levels.
The consolidation phase is less about direction and more about preparation - a deliberate build-up before a move that could catch traders off guard on both sides.
 Usman Salis


