 Usman Salis

⬤ Bitcoin made a significant move on the weekly timeframe after dropping below $74,000, triggering what traders call a sell-side liquidity sweep. This happened after BTC failed to hold above key levels—it's now trading well below the 2025 Yearly Open at $93,549 and the 2026 Yearly Open around $87,608.
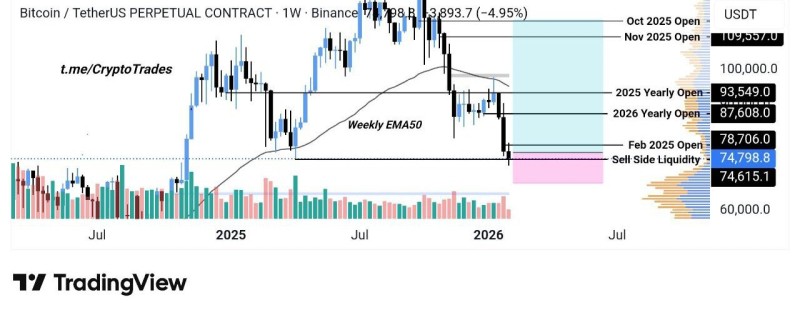
⬤ The chart shows Bitcoin breaking through the Weekly EMA50, which had been holding as support. Price sliced through the February 2025 open near $78,706 before diving into the sell-side liquidity zone between roughly $74,800 and $74,600. This area lined up with previous weekly lows where stop-losses were stacked up, creating that sharp downward spike as orders got triggered.
⬤ Now the question is whether Bitcoin can take back the $74,000 level. If it manages to push back above that zone, the February 2025 open and 2026 Yearly Open come back into play as realistic targets. There's resistance lurking around $78,000 to $81,000, with bigger targets near $90,000 if momentum picks up. But if BTC can't reclaim this ground, it'll stay stuck below multiple yearly opens—keeping downside pressure alive.
⬤ Weekly liquidity sweeps like this often mark turning points in the trend. Whether Bitcoin holds above $74,000 or keeps sliding will probably set the tone for the next few weeks. With price sitting at such a well-defined technical level, the upcoming weekly closes are going to be crucial for figuring out where this thing goes next.
 Usman Salis


